Events Tech

Open Source Monitoring Conference 2018

14. Nov 2018

Our Marco Fretz has visited the OSMC (Open Source Monitoring Conference) 2018 in Nuremberg and reports his impressions below.

The OSMC 2018

The four-day OSMC with around 300 visitors is all about monitoring tools, concepts and the automation of the monitoring system. Of course, Icinga2 is very well represented – in the talks, among the participants and organizers. The conference is organized by NETWAYS, the company behind Icinga2, and takes place annually at the Holiday Inn Hotel in Nuremberg.

On the first day there were workshops on various topics and on the fourth day a hackathon, with projects that were determined spontaneously. The English and German talks took place on the second and third day and were divided into three tracks. Thanks to the agenda (online, in front of the rooms and at the back of the badge), it was usually easy to decide on the most exciting track. Talks that you missed can be watched later online as video.

I only visited days two and three again (with the talks). With around EUR 1500.- for two days conference, three evening events and three nights in the hotel, the conference is also very attractively priced.

In any case, the OSMC is also known for the rich and excellent catering (all-you-can-eat) from breakfast to the evening events and the smooth organization – the hotel and conference check-in are completed in under a minute. This has come true again this year.

More impressions: #OSMC

Highlights

For me, the most important thing was to meet new and familiar faces and the related exchange about their own and other monitoring landscapes including their problems and solutions as well as, of course, the direct line to NETWAYS / Icinga. Thanks to the talk from @ekeih (scaling Icinga2 …), some people quickly found themselves running Icinga2 in a setup similar to ours.

Prometheus

Exciting talks about Prometheus or concepts that rely on Prometheus made me feel that Prometheus is becoming more widespread, not only in the “cloud native” world but, for example also for HTTP SLA monitoring (MORITZ TANZER, nic.at), network monitoring (MATTHIAS GALLINGER, ConSol), etc.

Our current plans at VSHN for the integration of Prometheus into our monitoring environment were thus confirmed.

IcingaDB

A big bottleneck in Icinga2 and Icingaweb2 is the IDO database (MySQL / Postgres), whose schema dates back to the Nagios and Icinga1 era and has been steadily worsening over time. At that time, a relational database for actually volatile status information such as service and host states, etc. seemed to make sense. In larger setups, however, the writes from Icinga2 to the DB are the bottleneck. Also, the query performance of Icingaweb2 suffers greatly in certain configurations for larger setups.

A lot of details are not yet known, however, Redis is used for the volatile status information and a SQL DB for the historical data. A first version already runs on a trial basis at Icinga and was presented in a live demo. I think it’s great that you can probably use the IDO DB and the IcingaDB module in parallel (transitionally), the same applies to the Icingaweb2 monitoring module – this will greatly simplify migration.

To take away

Try it out…

OpenAPM

OpenAPM is not a tool in itself but shows in a simple way which tools can be combined with each other to build an application performance management / monitoring landscape. Just try it here: https://openapm.io/landscape

Maps

Certainly exciting are the maps for Icinga2. You can give each host or service object the geolocation via custom variable, then they are automatically displayed on the map and grouped according to the zoom factor: https://github.com/nbuchwitz/icingaweb2-module-map

Rancher Monitoring

From the talk of @ClaudioKuenzler a plugin for easy monitoring of Rancher2 and Kubernetes: https://github.com/Napsty/check_rancher2

Conclusion

I have taken great ideas with me, met new people, ate a lot (and yes, the gin was good too (big grin)). A great conference that’s really worth it. I like to go again.

.

Marco Fretz

Marco is one of VSHN's General Managers and Chief Operating Officer.

Contact us

Our team of experts is available for you. In case of emergency also 24/7.

Contact us
General Tech

Release your applications faster and easier – move them to the cloud

27. Sep 2018

No matter where you work in the technical space of software development, you are probably in a hurry to launch the application that you are currently developing.

Your customers can’t wait – accelerate development

Time is money, and when you are on the verge of launching your next killer application time is a scarce resource. Your customers won’t wait forever, and you need to launch your applications as quickly as possible if you want to succeed in the fast-paced tech market.
You might also be pushed internally to keep time to market as fast as possible.
No time to build up internal resources, educate colleagues, gather know-how. You need to be faster than the competition. IT teams have to do more and more nowadays so the pressure is on to manage them smartly.

Common Problems With Launching Applications

The road to your application launch date can be a crooked one, with a lot of turns and even dead ends. This is why it is so important to quickly test each small improvement in one or more test environments before deploying it to the end-user visible production environment. The earlier an error in the application or environment is found the quicker and less effort you need to fix it.
One of the most costly and time-consuming errors are differences between the testing and production environments. They result in the application behaving correctly during testing, but then suddenly misbehaving in production even though the same application version was deployed, and you don’t know what the differences are that lead to the problems. These problems can lead to error messages or catastrophic failures on public facing apps and long-term damage to your reputation.
Another security-focused problem is to keep testing and production environments separate from each other to prevent faulty applications under test to ruin real customer data.
Instead of synchronizing dev/test/production environments manually and duplicate this labor for each step of the process you can automate your work using best practice cloud-based tools. 

Why Should You Move Your Applications To The Cloud?

There may be many different reasons why you may be reluctant to move your application to the cloud. You may be used to the classical way of building and testing applications or fear the migration effort, or you might not have the internal know-how or resources.
However, a well-prepared DevOps team leveraging the potential of the cloud can rapidly manage the deployment of applications without a substantial increase in either manpower or long-term costs. It can make it significantly easier to scale the application later in the process and provide access to helpful auxiliary services.
Unifying the different environments using open-source Docker software container technology helps you leverage the world-wide ecosystem and experience. The more parts of the process that you can automate and integrate, the more efficiently you can build and launch your application.

Whitepaper ‘5 Steps Of Moving Your Applications Successfully To The Cloud’

Migrating to the cloud is a big business decision, so it’s vital to go in with both eyes open. Download our 5 Steps Of Moving Your Applications Successfully To The Cloud whitepaper and find out how moving to cloud can help you meet your software and application development goals.

Markus Speth

Marketing, Communications, People

Contact us

Our team of experts is available for you. In case of emergency also 24/7.

Contact us
Internal Tech

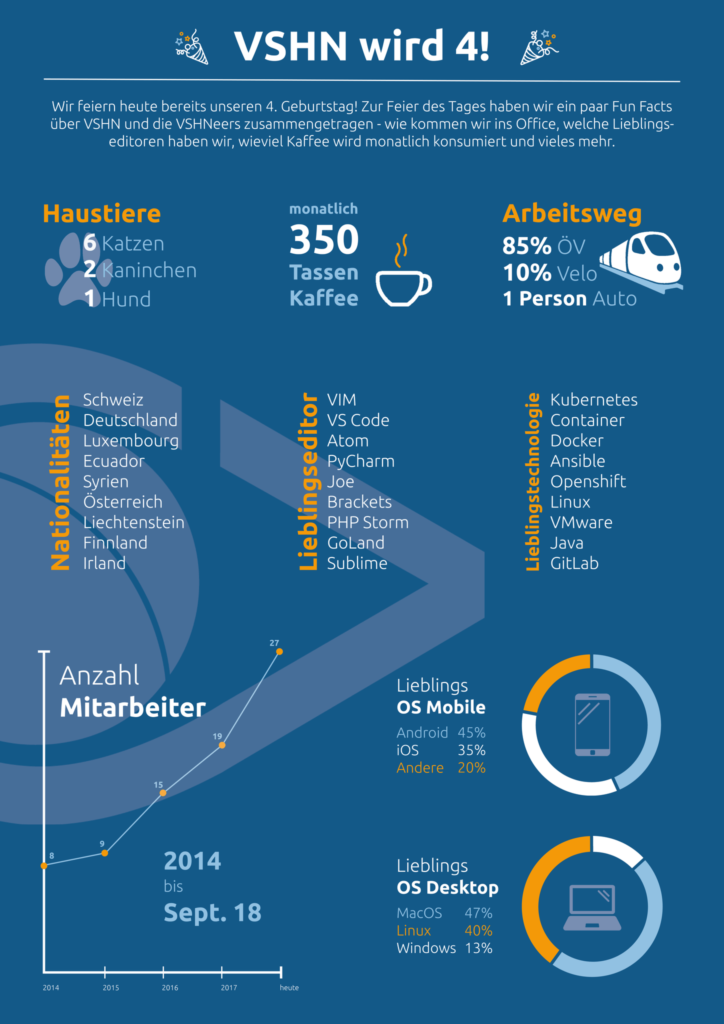
Wir haben Geburtstag!

16. Sep 2018

Aarno Aukia

Aarno is Co-Founder of VSHN AG and provides technical enthusiasm as a Service as CTO.

Contact us

Our team of experts is available for you. In case of emergency also 24/7.

Contact us
General Tech

How Docker and container technology can help your DevOps organization

15. Sep 2018

DevOps needs three things: people with the right attitude, shared processes and the right tools. Docker software containers helps solve these challenges and offers a standardized platform for development and operation.

Container from the perspective of the developer

From a web agency perspective, each project places different demands on the target system, such as different versions of programming languages ​​and frameworks. These  combinations must be thoroughly tested during development through Continuous Integration (CI), which is time-consuming and prone to error with traditional systems.
Container virtualization, for example with Docker, helps. Docker uses so-called images, compilations of software to launch individual instances of an app, called containers. Unlike traditional virtual machines, these images do not include an operating system and are therefore lighter and faster. Ideal for continuous integration.
From the perspective of the software developer, it is easy to configure the pipelines with Docker, for example within GitLab CI. The image is specified and the runner takes care of everything else. The application is thus tested encapsulated and requires no additional software on the server.

Container from the perspective of the operator

Docker containers are a standardized and efficient way to package software with everything it needs to run. On the one hand, this helps to minimize external dependencies at runtime, so that the versions of PHP, Java etc. used in the correct version with all required modules, extensions and plugins are not yet to be managed separately on the server.
On the other hand, a change of the application code is exactly the same as a change of the application server: a new version of the container image is automatically built and deployed in the test environment, then the same checked image can be rolled out in the production environment.

The Advantages of Standardizing the Software Containers are Analogous to the Containers in Logistics

  • Standardization makes containers more efficient: Just as a container ship transports 21’000 different containers with the same crew, a PaaS-provider can operate hundreds of thousands of containers on various customer infrastructures and cloud providers.
  • Containers standardize the handling of contents: in logistics, the pick-up points in the corners are exactly the same whether the contents are liquid, solid or gaseous. In software, entrypoint, list port and storage volumes are defined exactly the same, no matter whether PHP, Java or .NET Core should be executed.
  • Container technology is portable, so it works on all infrastructures and vendors just like any other means of transport.

The solution of software logistics is therefore called container orchestration and the most well-known implementation thereof is Kubernetes. It standardizes and automates software operations such as deployment / update, scaling, load-balancing, service discovery, storage volume management, monitoring, backup, distribution of containers to multiple servers and isolation of multiple applications, test environments, teams and / or customers.

So what does that mean for you – should you containerize your application?

There may be many different reasons why you may be reluctant to use Docker or container technology in general. You may be used to the classical way of building and testing applications using traditional VM technology or fear the migration effort, or you might not have the internal know-how or resources. Or you might have a legacy application which isn’t easily transferable or movable to the cloud.
So should you jump on this bandwagon – or to stay with the same terminology – ship?
A well-prepared DevOps team leveraging the potential of container technology can rapidly manage the deployment of applications without a substantial increase in either manpower or long-term costs. Moving your application to the cloud will be way easier using container technology like Docker, Kubernetes or OpenShift.
It can also make it significantly easier to scale the application, provide access to helpful auxiliary services and just in general make it more future-proof. So if you are coming from a legacy application, it probably will pay off in the future to invest resources now to make your application container ready.
Unifying the different environments using open-source Docker software container technology helps you leverage the world-wide ecosystem and experience. The more parts of the process that you can automate and integrate, the more efficiently you can build and launch your application.

Whitepaper ‘5 Steps Of Moving Your Applications Successfully To The Cloud’

If you want to learn more about migrating your applications to the cloud, download our free whitepaper ‘5 Steps Of Moving Your Applications Successfully To The Cloud and find out how moving to the cloud can help you meet your software and application development goals.

Markus Speth

Marketing, Communications, People

Contact us

Our team of experts is available for you. In case of emergency also 24/7.

Contact us
Kubernetes Tech

What is a Kubernetes distribution and what are the differences between Kubernetes and OpenShift?

30. Aug 2018

At VSHN and APPUiO.ch we rely on OpenShift as Kubernetes distribution. What a Kubernetes distribution is, why we use it and where the differences to ‘plain’ Kubernetes will be explained in this blog post.

What is Kubernetes?

The official description of Kubernetes is:

Kubernetes is a portable, extensible open-source platform for managing containerized workloads and services, that facilitates both declarative configuration and automation.

The most important part of this description is the fact that Kubernetes is a platform and not a ready off-the-shelf product. This is an important piece of information for understanding this article.

What is a Kubernetes distribution?

To understand the differences between Kubernetes and OpenShift, first of all we have to clarify the term ‘Kubernetes distribution’: if Kubernetes is installed directly from the open source Kubernetes project, you ‘only’ get the core components (API server, controller manager, scheduler, Kubelet, kube-proxy). In order for Kubernetes to be really usable, you need a lot of other components like etcd, ingress controller, logging server, metrics collector (for example Prometheus), software defined network (SDN) and many more. This is very similar to Linux: the Linux kernel alone does not help much, you need a whole Linux distribution which provides a shell, package management, boot process and much more.

OpenShift is a Kubernetes distribution and makes Kubernetes a product

A ‘minimum viable Kubernetes distribution’ requires the following additional components and tools for productive operation:

  • Installation and upgrade mechanism: for an automated installation of all involved components.
  • SDN (software defined network): pods must be able to communicate with each other no matter where they are running. The SDN ensures that.
  • Ingress controller: to allow user access to applications running on the cluster.
  • Authentication: a central user and group database provides the authenticated and authorized access.
  • Security: Kubernetes executes containers via Docker or CRI-O. The security on the host system must be ensured accordingly.
  • Persistent storage: stateful applications such as databases require persistent storage.
  • Monitoring: constant monitoring of all cluster components and applications.
  • Backup: backup of cluster components and persistent data.

Optionally, further components are recommended:

  • Central logging with graphics and searchability
  • Application and cluster metrics including alerting

OpenShift as Kubernetes distribution

Essentially, OpenShift relies 100% on Kubernetes, but as a Kubernetes distribution, it comes with everything needed for a Kubernetes cluster. To name just the most important functions:

  • Operations tools: an official and supported way via Ansible allows the entire lifecycle of OpenShift to be executed. This includes the automated installation, as well as upgrades to newer versions of OpenShift.
  • Router: the OpenShift router (ingress controller) – based on HAProxy – ensures that access to applications within the cluster is made possible via HTTP(S).
  • Multi-tenancy: multi-tenancy is built-in the core on OpenShift projects, RBAC and other concepts to allow the use of the platform by various stakeholders.
  • Authentication: the most different authentication backends are supported, above all LDAP, Active Directory (AD) and others.
  • Metrics: the bundled metrics component collects all available data (RAM, CPU, network) of the applications running on the cluster and visualizes them in the web console.
  • Central logging: all lines logged by the application on stdout are automatically collected by the central logging component and are made available to the user via the web console.
  • Security: the platform is designed for maximum security. For example, security measures in the kernel of Red Hat Enterprise Linux like SELinux ensure that the security of the containers is guaranteed. Further measures such as ‘security context constraints’ (SCC) and the prevention of root containers ensure further security.
  • Builds and pipelines: directly in the cluster integrated build and pipeline capabilities enable a fully integrated CI / CD workflow.
  • Web console: all operations on the cluster are visually displayed to the user of the platform in a web console and allow an easy and quick access to the use of Kubernetes.
  • SDN: the included software defined networking provides connectivity between the pods running on the platform and for an adequate network security with network policies.
  • Container registry: Docker / container images are stored in the bundled registry and used for deployment onto the worker nodes.

All these built-in functionalities can be added to any Kubernetes cluster, but only with a lot of effort. Comparable to building your own Linux distribution, as for example  Linux From Scratch demonstrates. Kubernetes has a similar guide called Kubernetes The Hard Way.

OpenShift as PaaS

The strength of Kubernetes lies in the container orchestration. In addition, OpenShift offers classic Platform-as-a-Service (PaaS) functionalities. One of these is the automatic building and deployment of application code directly from a Git repository. Nevertheless, as a user of the platform and thanks to its great flexibility, you always have the choice of whether you want to use the integrated build functions, or rather build outside the cluster. This can be chosen for each deployment, so both types can be used on one cluster.

OpenShift as upstream to Kubernetes

Many developments in Kubernetes originally came from OpenShift. The best example is RBAC (role based access control). This feature has been part of OpenShift since the first release and has been gradually integrated into Kubernetes. RBAC has been an integral part of Kubernetes since Kubernetes version 1.6. The OpenShift ‘Route’ or the ‘DeploymentConfiguration’ object also played a key role in the current objects ‘Ingress’ and ‘Deployment’ in Kubernetes.
Since OpenShift is 100% based on Kubernetes, all Kubernetes native workloads are also supported, such as the ‘Deployment’ or the ‘Ingress’ object.
If you look more closely at the contributor statistics, you’ll find that Red Hat is one of the top 3 contributor companies, so Red Hat is crucial in the development of Kubernetes. With the purchase of the company CoreOS, Red Hat has acquired formidable Kubernetes know-how. The merger of OpenShift and Tectonic will be the next milestone of the Kubernetes distribution OpenShift.

Alternatives to OpenShift

OpenShift is not the only Kubernetes distribution on the market. A quick comparison shows the differences:

  • Cloud vendor Kubernetes: the big clouds offer their own Kubernetes distributions as a service. These are tailored to the respective cloud and are maintained by the providers. Installation on your own private cloud or on other public clouds is not possible.
  • Rancher: since version 2.0, Rancher focuses 100% on Kubernetes and offers a multi-cluster management function as a major strength. With Rancher, Kubernetes clusters in the cloud (for example, on Amazon or Google) can be managed centrally, as well as Kubernetes clusters with the ‘Rancher Kubernetes Engine’ on your own VMs. With the web interface, setting up a new cluster is very easy and application deployments using Helm are also directly available.
  • Tectonic: this distribution lies great importance on cloud-native automation. Through Red Hat’s acquisition of CoreOS, Tectonic will be merged with OpenShift and many of its features will inserted into OpenShift.
  • Canonical / Ubuntu Kubernetes: platform based on Ubuntu, which uses Juju as installation tool. In partnership with Google and Rancher, a hybrid cloud solution will be offered in the future.
  • SUSE CaaS platform: a very new platform based on SUSE MicroOS. Salt is used to ensure configuration management. Under the following link you can participate in the beta program: SUSE CaaS Platform Beta.

Further Kubernetes distributions include:

One very important aspect to consider is the cloud and / or vendor lock-in. Many of the Kubernetes distributions have their own characteristics, which may not be compatible with each other. Using the example of ‘cloud vendor’ distributions: these can only be used in the corresponding cloud. However, if you want to pursue a hybrid cloud approach, this is not possible due to the lock-in. In contrary, a self-installable distribution like OpenShift makes this option possible.
Pure open source distributions without manufacturer support are not recommended for productive environments, as this is of great advantage for a complex platform like Kubernetes.

APPUiO – Swiss Container Platform

The attentive reader may have noticed that there are some discrepancies between the ‘minimum viable Kubernetes distribution’ and OpenShift. This is exactly where APPUiO comes in: we refine OpenShift into a comprehensive, production-ready Kubernetes distribution by offering managed services. We automatically monitor and secure the cluster status, take care of regular updates, fix bugs, provide persistent storage and help with our know-how to make the most out of the platform.

More information about Kubernetes and OpenShift

At the Cloud Native Meetup on August 28, 2018 in Zurich, we also talked about Kubernetes distributions: you can find the slides on Speaker Deck. You can also find more about OpenShift, Docker and Kubernetes here. Another recommendable blog post on this topic by Tomasz Cholewa: 10 most important differences between OpenShift and Kubernetes (English, technical).

How can we help?

Through our experience in operating OpenShift clusters around the world, we offer managed OpenShift clusters on almost any public, private or on-premise cloud. Or are you interested in another Kubernetes distribution than OpenShift? We gladly help you with the evaluation, integration and operation and support with our many years of Kubernetes experience.
Contact us, follow us on Twitter or take a look on our services.
We are looking forward to your feedback! 

Tobias Brunner

Tobias Brunner is working since over 20 years in IT and more than 15 years with Internet technology. New technology has to be tried and written about.

Contact us

Our team of experts is available for you. In case of emergency also 24/7.

Contact us
Tech

Docker Overlay Encryption

24. Aug 2018

Docker Swarm with encrypted node-to-node traffic

VSHNeer Elia set up a Docker Swarm Cluster with full traffic encryption inside the cluster (crosspost to his private blog):
I have set up a Docker Swarm cluster on the new Hetzner Cloud. First things first – the Hetzner Cloud is really amazing: Super simple, super cheap and performs as expected. It is not a bloated cloud provider that has 100x services and features that you can use for your servers, this keeps the costs and complexity down – I am really a big fan of it.
To the topic: Because the feature-set is simple, the Hetzner Cloud does not provide private networking (yet!). With only public IP addresses, we need to secure the overlay traffic between our docker containers!
 

The Problem

Per default, Docker Swarm encrypts the traffic between the managers, so we won’t have any issues there. However, this default setting is not set for container-to-container traffic. Any traffic that uses the overlay network is not encrypted by default because most of the time people do have private network setups with a floating IP as access point to the cluster. Docker assumes that the private network is secure and thus can spare some resources for other tasks (Which for example is not the case at DigitalOcean, so I recommend using overlay encryption anyway!).
Now, let’s assume we have the following stack:

version: '3'
services:
  db:
    networks:
      - internal
    image: mysql:5.7
    environment:
      MYSQL_DATABASE: wordpress
      MYSQL_USER: wordpress
      MYSQL_PASSWORD: securepw
  wordpress:
    networks:
      - traefik_public
      - internal
    depends_on:
      - db
    image: wordpress:latest
    environment:
      WORDPRESS_DB_HOST: db:3306
      WORDPRESS_DB_USER: wordpress
      WORDPRESS_DB_PASSWORD: securepw
    deploy:
      labels:
        - traefik.frontend.rule=Host:blog.example.com
        - traefik.docker.network=traefik_public
        - traefik.port=80
networks:
  traefik_public:
    external: true
  internal: 

This is a WordPress Stack that creates the WP site and a MySQL database. Those two networks are defined:

  • internal
  • traefik_public

The interal  overlay network is used for the communication between the WP container and the database. This network is not reachable by the outside. traefik_public  is the network used for the reverse proxy. It is only attached to the WP container as this is the only public facing side of this setup.
The problem here is: Without a secured private network, traffic running through the network internal will go out to another worker (Docker Node), and this fully plain visible. Any password/authentication/<SENSITIVE_DATA> is sent plain text between the docker containers, should they be on two different nodes.
Most of the docker images are not made for public access in their simple utilization and that’s why most keep it as simple as possible, no complicated encryption. You can of course build your own image to enable application side encryption.

The Solution

Docker has a solution for this issue. You can simply enable encryption of the overlay network. Sadly I really didn’t see much discussion about this hence why I thought a blog post about this particular issue might be useful.
The encryption of the network needs to happen during it’s creation, you cannot encrypt a network once it has been setup already. To enable encryption we need to add a flag to the network definition:

networks:
   traefik_public:
     external: true
   internal:
     driver_opts:
       encrypted: ""

The network traefik_public  is of course also encrypted as you don’t want the reverse proxying in plain text.
The option encrypted  will create a IPSec tunnel between all the workers where tasks are scheduled for a stack. This will fully encrypt all the traffic of the overlay network internal and thus allow sensitive data being shared between the database and WordPress.
You can read the official documentation about this here.
 

Final thoughts

The information in regards of encryption is very “hidden” and mostly ignored in my opinion. People want to simply deploy applications with docker without thinking about the infrastructure under it and thus running into the problem like plain text traffic on overlay networks.
I hope to make people more aware of encryption with this blog post.
If you have any questions, please let me know below!


Elia Ponzio

Contact us

Our team of experts is available for you. In case of emergency also 24/7.

Contact us
Tech

Hosting Drupal on Openshift with the help of Lagoon – by Bastian Widmer (Amazee.io)

3. Jun 2018

Amazee.io set out to make hosting of Drupal websites easier and more flexible. We always strive to stay at the cutting edge of technology. So it does not come to a surprise that we started adopting a container based approach to hosting. We’ll talk about what containers are and why we believe it’s important to go one step further and open source our technology we use to host websites.
 

How Does Hosting Without Containers Look Like?

First and foremost, it’s less flexible. If your project has special needs (i.e. caching with redis or a decoupled frontend with node.js)that your provider does not support, you might end up in a tricky situation.
You might have to either add another provider that supports your technology or you find another provider which hosts your project on one platform.
Adding another provider to the mix ads more complexity and less streamlined support structures if you ever run into issues. amazee.io’s new system, Lagoon, gives developers the flexibility to create their own service architecture, supporting everything from a simple Drupal website to a high traffic website with a decoupled frontend and server side rendering. We do this with through the magic of containers.
 

So, What are containers?

You can think about hosting companies as shipping companies and the servers we have are ships that hold the code from individual projects.
Before the standard shipping container existed it was quite an endeavour to load and unload a ships cargo because everything had custom dimensions – so stacking them in an efficient manner was really hard.As soon as a standard was established – in this case the shipping container – everything got much easier because they were stackable and had all the same form factor.
This allegory shows that the age of custom servers is over. Sure you can run a lot of things on a server but it will not scale past a certain degree. Containerizing your applications makes it much easier to move between platforms because you follow a certain standard.
You can see why hosting companies solve this by only hosting one kind of thing. Drupal sites, for example. But the beauty of containers is that we can host all sorts of projects and still make everything efficient and optimized for our ships. We do this with the help of container technology.
 

Open source

We’re entering the third decade of open source as the Open Source Initiative celebrated its 20th anniversary beginning of February 2018. From the very beginning, amazee.io was committed to  basing our work open source software and technologies as much as possible.  This enabled us to continue the great work started byother projects and bring innovative solutions a step further our solutions a step further.
Every version of our hosting system is more flexible than the last, with more  functionality for our clients. We always saw it a bit troubling that we host open source CMS like Drupal or WordPress on proprietary solutions where you don’t know what happens behind the curtains. ast year we decided to go one step further and we have open sourced our Docker in Production hosting System. It’s there for everyone to look at it, understand it, tinker with it. We welcome feedback, contributions, and high fives at all times.
You can find more about our Project on our Website or if you want to talk about hosting we’re always there for you on our Slack

Aarno Aukia

Aarno is Co-Founder of VSHN AG and provides technical enthusiasm as a Service as CTO.

Contact us

Our team of experts is available for you. In case of emergency also 24/7.

Contact us
Tech

Automated build pipelines with GitLab CI and APPUiO

1. Apr 2018

Update: demo projects published

This article is now outdated! We have prepared a new set of demo projects with full source code, public CI/CD pipelines and Kubernetes integration. Please visit https://gitlab.com/appuio and let us know how you like them! Issues and Merge Requests welcome!

Overview

“Deploy early and often” is one of the core principles of agile development. One solution to this problem are automated build and deploy pipelines.
This project uses such a pipeline, based on GitLab CI and OpenShift. A sample PHP application is built and deployed to APPUiO.
Three environments in form of OpenShift projects are used: testqual and production. Those are the most commonly used setups but can be configured and extended. The idea is to build and deploy every commit from the master branch to the test environment automatically. If a git tag is created, the previously built docker image is tagged with the git tag name and automatically deployed to qual. The deployment to production is a manual step and can be invoked on GitLab.

Pipelines

There are two pipelines setup in .gitlab-ci.yml: One is run on every commit to the master branch and consists of the stages lintbuild and deploy-test. The lint stage starts a docker container in which the PHP code is verified for correct syntax. The build stage starts a new OpenShift build (S2I), waits for its completion and shows the log output of the build. The last stage automatically deploys the built image to the test environment.
The second pipeline is started upon creation of a git tag. It consists of the stages releasedeploy-qual and deploy-production. The first stage tags the docker image that was built for the respective git commit with the name of the created git tag. The deploy-qual stage deploys the tagged docker image automatically to the qualenvironment. The stage deploy-production needs to be started manually and deploys to the production environment.

APPUiO

The application and the build is run on APPUiO which allows us to use the concepts and solutions OpenShift provides to work with builds and deployments. The directory os contains the yaml-files which describe all the used OpenShift resources. These files live together with the code in the same git repository, which guarantees that the same version of the code is always built and deployed using same version of the OpenShift resources.

Build

The build consists of an OpenShift BuildConfig which uses a PHP source-to-image builder and builds a docker image containing the application. The image is tagged with the git commit hash and stored on the OpenShift docker registry.

BuildConfig
1
2
3
4
5
6
7
8
9
10
11
12
13
14
15
16
17
18
19
20
21
22
23
24
apiVersion: v1
kind: BuildConfig
metadata:
  labels:
    app: ${APPNAME}
  name: ${APPNAME}
spec:
  strategy:
    type: Source
    sourceStrategy:
      from:
        kind: ImageStreamTag
        name: 'php:7.0'
        namespace: openshift
      incremental: true
  source:
    git:
      ref: ${COMMIT_SHA}
      uri: ${REPOSITORY_URL}
    type: Git
  output:
    to:
      kind: ImageStreamTag
      name: '${APPNAME}:${APP_TAG}'

Deployment

DeploymentConfig is used to run the application. With the help of rolling deployments, zero downtime deployments are possible and the end user won’t experience any service disruption during updates. The liveness and readiness probes enable OpenShift to see if the container is running properly (liveness) and able to accept incoming traffic (readiness). Additionally an OpenShift service and route are set up to route traffic from outside the cluster to the application. The URL is specific for each environment and can be opened from within GitLab.

DeploymentConfig
1
2
3
4
5
6
7
8
9
10
11
12
13
14
15
16
17
18
19
20
21
22
23
24
25
26
27
apiVersion: v1
kind: DeploymentConfig
metadata:
  name: ${APPNAME}
spec:
  replicas: 1
  selector:
    app: ${APPNAME}
  strategy:
    type: Rolling
  template:
    spec:
      containers:
      - name: ${APPNAME}
        image: "docker-registry.default.svc:5000/${OPENSHIFT_PROJECT}/${APPNAME}:${APP_TAG}"
        imagePullPolicy: Always
        ports:
        - name: web
          containerPort: 8080
        livenessProbe:
          httpGet:
            path: /
            port: web
        readinessProbe:
          tcpSocket:
            port: web
      restartPolicy: Always

Demo

To see the pipeline in action you need three things:

  1. Your own fork of the repository on GitLab with GitLab CI enabled
  2. A project on APPUiO for each stage: test, qual and production
  3. A ServiceAccount with edit membership in all projects

Step by step

  1. Set up Kubernetes/OpenShift integration in GitLab: https://docs.gitlab.com/ce/user/project/clusters/index.html#adding-an-existing-kubernetes-cluster
  2. Configure .gitlab-ci.yaml with your APPUiO projects
  3. Commit & push the changes
  4. Watch the automated pipeline build the application and deploy it to the test project
  5. Create and push a git tag
  6. Watch the automated pipeline create image tags and deploy it to the qual project
  7. Manually run a deployment to the production environemnt by visiting the pipeline on GitLab and click “play” on the deploy:production job

Outlook

To further extend this setup, feature branches could be built and deployed to OpenShift. With this in place every merge request is built and a live version of the application is available to test the introduced changes. This ensures that only buildable changes are merged into the master branch and changes can be easily reviewed.
To learn more about automated builds and deployments with GitLab and APPUiO, read the docs and create a project on APPUiO Public.

Aarno Aukia

Aarno is Co-Founder of VSHN AG and provides technical enthusiasm as a Service as CTO.

Contact us

Our team of experts is available for you. In case of emergency also 24/7.

Contact us
Tech

APPUiO auf Microsoft Azure Cloud

15. Mar 2018

In the past few years, Microsoft has transformed itself from a classic Windows and Office provider to a modern cloud provider. The Azure Cloud has become a global hyperscale cloud platform with many interesting features. Red Hat has also recognized this and offers official support from OpenShift to Azure. Mit der Ankündigung von Microsoft die Azure Cloud auch in die Schweiz zu bringen, könnte dies für viele Schweizer Firmen ein interessantes Angebot sein. Als Microsoft Azure Partner für Open Source Software in der Schweiz zeigen wir anhand eines Beispiels wie OpenShift auf Azure installiert werden kann. Kurz gesagt: Funktioniert wunderbar.

Was haben wir gebaut?

Für uns ist die Automatisierung aller Aspekte von Installation, Konfiguration, Monitoring, Updates etc das Wichtigste für einen stabilen und skalierbaren Betrieb einer Infrastruktur. Dies gilt insbesondere für ein komplexes System wie OpenShift in der Cloud. Daher wollen wir zeigen, wie einfach, schnell und automatisiert sich alle notwendigen Komponenten einrichten lassen. Dafür haben wir uns an den Referenz Architektur Guide gehalten.

Desweiteren wollten wir in Erfahrung bringen, welche Azure Services benutzt werden können und wieviele Pods wir ohne Tuning laufen lassen können.

Wie hat es funktioniert?

Der Referenz Architektur Guide orchestriert alle Komponenten mit Ansible. Die Infrastruktur Komponenten auf Azure werden dabei mittels der offiziellen Ansible Integration unter Zuhilfenahme des Azure Resource Manager aufgesetzt. Anschliessend übernimmt das offizielle OpenShift Ansible Playbook die Arbeit und installiert und konfiguriert OpenShift.
Benutzt werden eine ganze Reihe von Azure Services:

  • Availability set
  • Load balancer
  • Network interface
  • Network security group
  • Public IP address
  • Storage account
  • Virtual machine
  • Virtual network

Bei dieser grossen Anzahl zu pflegender Services kommt man um Automatisierung nicht herum. Mittels Ansible lässt sich das sehr gut bewerkstelligen.

Mit den 9 provisionierten Nodes dieses Beispiels haben wir einen Demo-Service erfolgreich auf 300 Pods skaliert:

Unser Fazit

OpenShift auf Azure ist eine gute Wahl. Die Azure Cloud bietet sehr viele essenzielle Services, welche einen reibungslosen Betrieb von OpenShift ermöglichen. Gerne unterstützen wir Sie bei Ihrem Azure Cloud Projekt.

Tobias Brunner

Tobias Brunner is working since over 20 years in IT and more than 15 years with Internet technology. New technology has to be tried and written about.

Contact us

Our team of experts is available for you. In case of emergency also 24/7.

Contact us
Tech

Meltdown und Spectre

4. Jan 2018

Am 4. Januar 2018 wurden Informationen über zwei Angriffe auf aktuelle Prozessor-Architekturen veröffentlicht, genannt “Meltdown” und “Spectre”, welche auch uns und unsere Kunden betreffen. Während die unterliegenden Probleme ähnlich sind, handelt es sich dabei um zwei unterschiedliche konkrete Angriffe.

Kurzdarstellung der Sicherheitslücken

Grundsätzlich unterstützen CPUs einen gewissen Instruktionssatz. Dieser ist funktional genau definiert, so dass sich Anwendungen darauf verlassen können, dass der Prozessor zum richtigen Resultat kommt. Wie genau der Instruktionssatz in der Praxis implementiert wird, ist jedoch dem Prozessorhersteller überlassen. Um die Ausführungsgeschwindigkeit zu erhöhen, wenden die Prozessorhersteller alle möglichen Tricks an; z.B. versucht der Prozessor, mehrere Instruktionen gleichzeitig abzuarbeiten (“pipelining”), oder er versucht zu erraten, welcher Pfad durch Fallunterscheidungen im Programm der wahrscheinlichste ist, und führt diesen auf gut Glück aus, mit dem Risiko, das Resultat verwerfen und nochmal weiter vorne beginnen zu müssen (“speculative execution”, “branch prediction”). Diese Mechanismen haben zwar auf das Endresultat einer Berechnung keinen Einfluss, sehr wohl aber auf den zeitlichen Ablauf und den Inhalt der CPU-Caches. Die genannten Angriffe nutzen das nun aus, indem sie den Prozessor dazu verleiten etwas zu tun, was er nicht darf und was er anschliessend auch korrekt verwirft; aber über geschickte Zeitmessungen kann das Programm herausfinden, was für Werte aus dem Speicher dabei verwendet wurden. Über diesen Kniff kann ein entsprechendes Programm unter anderem geschützten Speicher des Systems auslesen und so z.B. Zugriff auf Verschlüsselungs-Keys erhalten. Im Falle von virtualisierten Umgebungen ist das besonders schlimm, denn der Angriff funktioniert auch über die Grenzen virtueller Maschinen hinweg; Es ist so möglich, auf den Speicher von anderen virtuellen Maschinen zuzugreifen.
Die technischen Details sind komplex und sprengen den Rahmen dieses Blog-Artikels bei Weitem, können aber auf der eigens dafür eingerichteten Webseite https://meltdownattack.com nachgelesen werden.

Bewertung

Innerhalb eines einzelnen Systems (ob physisch oder virtuell) haben die Angriffe den Charakter einer Rechteausweitung. Das bedeutet, dass ein einfacher User, der beliebige Software ausführen kann, Zugriff auf das System erhält, welcher nur ein Administrator haben dürfte. Das ist zwar sehr schlecht, aber bei Systemen, bei welchen grundsätzlich nur vertrauenswürdige User Software ausführen können, für sich alleine noch kein Problem. Das trifft typischerweise z.B. auf Web-, File- und Datenbankserver zu.
Bei Systemen, auf welchen beliebige User Software ausführen können, ist die Lücke katastrophal, denn nun ist die Trennung der User oder gar Kunden (Firmen) nicht mehr sichergestellt. Das betrifft z.B. Virtualisierungs-Server (Xen, KVM, VMWare) oder Docker-Server, auf denen beliebige User virtuelle Maschinen beziehen oder Docker-Container ausführen können. Die User können auf solchen Systemen innerhalb einer VM oder eines Docker-Containers bösartigen Code ausführen und Zugriff auf den Speicher anderer VMs oder Docker-Container erhalten. Für derartige öffentliche Virtualisierungsplattformen (z.B. Amazon AWS, Google Compute Engine, Cloudscale) ist daher sofortiges Handeln zwingend nötig.

Massnahmen

Für die gängigen Betriebssysteme stehen Sicherheitsupdates zur Verfügung oder sind in Arbeit. Da sich das Problem auf Ebene Hardware derzeit nicht lösen lässt, modifizieren die Betriebssysteme die Art und Weise, wie sie mit geschütztem Speicher umgehen. Dabei wird der Betriebssystem-Kernel nicht mehr im Speicherbereich jedes Prozesses eingeblendet, sondern ist nur noch nach einem Kontext-Wechsel (Wechsel in eine andere “Speicher-Arbeitsumgebung”) erreichbar.
Dies ist ein massiver Umbau. Einerseits führt er zu einem Performance-Verlust, weil der Kontext-Wechsel für den Prozessor aufwändiger ist als die heutige Umsetzung. Es ist von Geschwindigkeitseinbussen von 5% bis zu 30% die Rede. Wir rechnen für die meisten Anwendungsfälle mit Geschwindigkeitseinbussen von unter 10%, also nicht im spürbaren, aber knapp messbaren Bereich. Andererseits bedeuten solch umfangreiche Umbauten ein Risiko für Bugs und neue, bisher unbekannte Stabilitätsprobleme, weshalb sofortiges Aktualisieren aller Systeme nicht zwingend die beste Vorgehensweise ist.
Da allerdings die Sicherheitsprobleme im Falle von Systemen mit nicht vertrauenswürdigen Usern derart gravierend sind, müssen wir diese Systeme zwingend so bald wie möglich aktualisieren. Das betrifft konkret primär die APPUiO-Public-Plattform; Für alle anderen Systeme evaluieren wir das Vorgehen noch, jedoch werden diese spätestens im nächsten Wartungsfenster am 9. Januar aktualisiert und erhalten dann entsprechend angepasste Linux-Kernel.

david.gubler

David ist DevOps-Engineer und Entwickelt fliessend Java und MongoDB

Contact us

Our team of experts is available for you. In case of emergency also 24/7.

Contact us
Tech

NoSQL – Why you should use MongoDB instead of a relational database

4. Oct 2017

What’s wrong with relational databases

Stored procedures and triggers
For some people, a database just stores data. For others, a database is more like an application server, with stored procedures, triggers, CSV exports to the file system, cleanup jobs and code to expire user accounts. I think a database should store data. Period. Embedding application logic in a database is bound to end up in a huge mess:
  • Who maintains the stored procedures and triggers? The application on startup? A hacky collection of bash scripts? The sysadmin, manually? Nobody at all, because “we have a backup”? Any combination thereof?
  • Are they kept under version control, or are they just floating around?
  • How do you keep track of the versions of stored procedures and triggers? Not at all? “We add a version number to the name”? “We don’t change them”? And related to this:
  • How do you run different versions of your application in parallel (during a rolling release), if they require different versions of your stored procedures and triggers?
  • How do you track which ones are still needed? I bet the answer is: Not at all.

Of course, I’m trying to make two points here: First, if you’re stuck with a relational database, don’t use these features; you’ll make your life easier. Second, if your alternative database doesn’t have these features, don’t think of it as a negative. You’ll be forced to find better solutions right from the beginning.
Schema changes
Nobody likes schema changes. On larger tables, they may take tens of minutes or hours, during this time the database is often at least partially unavailable. This can be a complete show-stopper for deployments during the day, making continuous deployment impossible. Worse yet, in my experience it’s not even possible to figure out beforehand how long a schema change will take; you can try it on a development system with a copy of the production database, and it may take a completely different amount of time than on the production servers, even with equal hardware, cache warmup etc.
Also, during rolling releases, you may have multiple versions of the application trying to set up a different schema, or one of the applications may fail if it doesn’t like the current version of the schema.
There are some tools, most notably pt-online-schema-change by Percona to work around this. But they drastically increase the complexity of a deployment, and I even don’t want to think of the number of ways in which this can go wrong.
Failover and High Availability
Many relational databases don’t have good options for replication and failover. One example is PostgreSQL, which currently only offers simple replication without any sort of failover or HA. There are some tools that work on top of PostgreSQL which try to provide this functionality, but they are complex to set up, even more complex to manage and can fail in an even greater number of ways – very far off from anything one could call “high availability”.
A notable exception, kudos to them, is MySQL/MariaDB with its Galera cluster feature. While it’s implementation is very complex and not without issues, it mostly works well and is more or less easy to set up and administer. If you must go for a relational database, go for MySQL/MariaDB, because you can easily switch to a Galera cluster later! (Shameless plug: We offer Galera as a managed service, and we’ve got it all ready for you if you’re interested).
Normalization
So you’ve got some object in your application. This object is associated with a number of users, there are comments, and you can attach files to it. What do you do in a relational database? You create a table for that object, a table for the n:n relationship to your users, a table for the comments, a table for the file metadata (assume the file is stored elsewhere).
Now, you’ve got some heavy users of that feature. One of your objects has 50 comments, 140 user IDs attached to it and 15 files. Now your application needs to display this object.
The database needs to fetch one of your objects, 50 comments, 140 user IDs and 15 file metadata entries. That’s over 200 rows! Since the data was probably added over time, it’s not stored sequentially, hence typically your database server will have to fetch 200 random 4k blocks from your SSD, only to read a single one of your objects!
Wait, it gets worse. Let’s have a look at your indexes.
The n:n relationship between your object and your users contains #objects * #usersPerObject entries. Depending on how large usersPerObject is, the total number of rows in this n:n relationship can be huge, much bigger than the number of objects and the number of users.
You could, for instance, easily have 10 mio users, 10 mio objects and 200 mio entries in this n:n relationship.
This n:n relationship probably needs two indexes. These indexes are going to be huge, possibly bigger than all your object and user data combined. They occupy a lot of RAM, and they are just overhead, not actual user data.
Wouldn’t it be nice to store your entire object in one place, without the need to join all those tables? All of it could fit in a few sequential 4k blocks!
Oh. And don’t get me started on maintaining consistency in a normalized database. Yes, I, too, have written tools that iterate over the database, trying to find orphans and broken foreign keys.
SQL
Your application has to assemble what you want into a single string, and the database server has to parse that string and figure out what you wanted in the first place. That’s just wasteful, never mind all the injection issues. Why don’t you tell the database server directly what you want, in a structured form?

Ok, so relational databases are bad because of normalization and schema changes, some are bad in terms of HA, and I’m shooting myself in the foot if I’m using stored procedures. How can I do better?

Easy. Just store your object in one piece as JSON, without schema restrictions on the database.

  • No more wasteful n:n relationships
  • No more schema changes
  • Far fewer or even no more orphans in the database
  • Data much easier to navigate and understand

Now, even some relational database vendors have come to realize that this is the way to go, e.g. PostgreSQL has added such features in recent versions. But if you want it all, you’re probably better off with a database like MongoDB, which is built around these core concepts, and offers all the advantages.
Stored procedures and triggers
Stored procedures are not offered by MongoDB. It can execute server-side JavaScript, but it doesn’t store the code for you (hence none of the issues of stored procedures).
MongoDB doesn’t have triggers. Because triggers are often only used to ensure consistency in a normalized schema and MongoDB doesn’t have that, they’re not really needed anyway.
Schema changes
No schema, no schema changes.
(Of course your application has a schema, otherwise it couldn’t interpret the objects read from database, but the database doesn’t care how it looks).
Failover and High Availability
MongoDB supports easy-to-use and powerful replica sets. There can only be one writeable primary, though. If you need multiple primaries for performance (which you probably won’t since MongoDB’s write performance is excellent), you can use sharding (also supported out of the box).
Normalization
Typically, you put your entities into one document, therefore there is no normalization going on. However, don’t think you can just store anything you want in the database. Just because the database doesn’t enforce a schema doesn’t mean that you don’t have to put in some effort to find a good data layout, which may include spliting up data into multiple collections.
SQL
As the well-known term “NoSQL” suggests, MongoDB doesn’t support SQL. Instead you tell the server what you want in a structured form. This is something that seems alien at first, but you’ll get used to it.

Ok that’s great, but what about transactions?

MongoDB doesn’t support transactions per se. But, as long as you stay within one document, you can change any number of things atomically (“at the same time”) as you want, which kind of acts as a replacement for transactions. This means, in turn, that if your application needs atomicity for some use cases, you must make sure that all the data involved in this operation is living in a single document.
Does this sound like a problem to you? Think about this:
Relational databases have multiple levels of transaction isolation. You would need the highest levels of isolation to ensure that nothing can go wrong, but performance is so poor with that kind of isolation that even banking software doesn’t use it.
The second problem of transactions is: They don’t do what you want. You don’t want a user’s action to fail if another user changes something concurrently. Instead, you want the two changes to get merged, without loosing any user’s changes. Relational databases don’t offer any kind of semantics for that, this just sort of happens (or doesn’t) depending on the database layer implementation in your application. MongoDB offers update operations which don’t have that problem, because they only change selected parts of a document, and the change has very clear semantics, even in the presence of other, concurrent changes.

Help! I’m all for MongoDB, but I need to convince my boss!

Put these in your PowerPoint presentation (remove the comments in parentheses):

  • Your application will have better performance, because there’s no need to normalize data (given a good implementation).
  • Your application will have better availability, because replica sets can be set up easily and work very well.
  • There is faster product development, because new features can be added more easily without the need for schema migrations.
  • There will be lower system administration cost, because MongoDB is easier to set up, tune and maintain than relational databases.

Are there any downsides?

There are.

  • MongoDB is in many ways very different from a relational database, among other things you have to re-learn how to create a good schema and how queries and updates work.This is asking a lot from your development team.
  • A MongoDB document is a BSON (binary form of JSON with some extensions) blob. Each document repeats the keys, and that’s redundancy you don’t have with a relational database. This can be mitigated by choosing short key strings and using document level compression.
  • Server-side Javascript execution was always kind of slow when I used it (which unfortunately includes the built-in map/reduce functionality). Things may have improved in the meantime, though. But if you stick to normal query/update operations and (if required) the aggregation framework, you’ll have great performance.
  • Replica Sets only have one writeable primary node and sharding is complex to set up. Won’t be an issue for most applications, though, because write performance of a single primary is really good.
  • There is no good PHPMyAdmin analog.
  • If you want to migrate an existing application to MongoDB, it will be a very painful and tedious process, as you’ll have to rewrite all of your database layer and take care of data migration. It can easily take you years to do a full migration. Don’t underestimate this.
  • While the original storage engine of MongoDB, mmapv1, was very robust, and its successor wiredTiger is faster and has better features, we’ve also seen cases in which a crashed wiredTiger database couldn’t recover on its own. This is not a problem in a replica set (you can just delete the data on the replica and let it re-sync), but it can be a problem on a single server. However, the MongoDB team is aware of these issues and we expect that they’ll get fixed.

david.gubler

David ist DevOps-Engineer und Entwickelt fliessend Java und MongoDB

Contact us

Our team of experts is available for you. In case of emergency also 24/7.

Contact us
Tech

Serverless Computing / Functions as a Service mit APPUiO und Snafu

22. Sep 2017
Was ist Serverless, auch FaaS (Function as a Service) genannt?

Die Begriffe “Serverless” und “FaaS (Function as a Service)” werden in jüngerer Zeit immer öfter in Artikeln erwähnt. Um was geht es eigentlich bei diesem Thema? Unter “FaaS” versteht man die Möglichkeit, eine Programmfunktion “in der Cloud” zu betreiben. Dabei speichert der Entwickler die gewünschte Funktion (egal in welcher Programmiersprache abgefasst, so lange vom Anbieter unterstützt) im FaaS Service der Wahl und ruft diese z.B. über HTTP oder einen Servicebus auf. Dabei muss der Benutzer der Funktion sich weder um die Ausführungsumgebung, Skalierung noch die Konfigurationsdetails eines Applikationsservers kümmern. Daher kommt auch der Begriff “Serverless”, welcher sagen möchte, dass die Funktion “einfach läuft”, sozusagen ohne Server. Eine Funktion kann eine einfache “Eingabe-Verarbeitung-Ausgabe” Funktion sein, komplexe Berechnungen durchführen oder Daten aus anderen externen Diensten beziehen, verarbeiten und speichern.
Der Einsatz von FaaS macht vor allem dann Sinn, wenn es sich um eine spezialisierte Funktion handelt, welche von diversen Microservices verwendet wird. Auch ökonomisch lässt sich der Einsatz von Funktionen in der Cloud gut begründen: Bezahlt wird für der einzelne Funktionsaufruf (je nach Anbieter). Wird die Funktion nicht genutzt, fallen auch keine Kosten an. Dies ist ein “echtes” Cloud Modell, ganz im Sinne von “Pay per Use”.

(more…)

Tobias Brunner

Tobias Brunner is working since over 20 years in IT and more than 15 years with Internet technology. New technology has to be tried and written about.

Contact us

Our team of experts is available for you. In case of emergency also 24/7.

Contact us
Tech

DKIM – Ein Baustein im Kampf gegen Spam mit gefälschten Absenderadressen

30. Aug 2017

DKIM (DomainKeys Identified Mail, RFC6376) geht auf eine Entwicklung von Yahoo aus dem Jahre 2004 zurück. Es handelt sich dabei um ein Protokoll zur Sicherstellung der Authentizität von Absendern in E-Mails. Der Standard dient also der Eindämmung von unerwünschten E-Mails wie Spam oderPhishing, welche grösstenteils mit gefälschtem Absender in den elektronischen Postfächern landen.

(more…)

andre.keller

Contact us

Our team of experts is available for you. In case of emergency also 24/7.

Contact us
Tech

Introduction to OpenShift on Exoscale

22. Aug 2017

“OpenShift is to Kubernetes similar to what a Linux distribution is to the kernel.”
The world is talking about the Kubernetes Project – but did you hear about OpenShift? It’s an open source product based on the open source projects Kubernetes and Docker plus a container builder/registry, and a Web GUI to manage it all. This blog post will introduce you to OpenShift and give some hints why to use it, how to get started, and where you can get professional support and managed services.

What is OpenShift and why should you use it?

It describes itself as “the industry’s most secure and comprehensive enterprise-grade container platform based on industry standards, Docker and Kubernetes”. It’s much more than that – it gives you a complete Kubernetes cluster with many cool features: integrated build pipelines, Docker Registry, Application router (for getting traffic into the cluster), security based on RBAC and SELinux, Web Console for easy access, central logging of all Pod output, Metrics to measure Pod performance, Installation and upgrade using Ansible Playbooks, Source-to-Image builds, and much much more.
As a Linux distribution acts to the Linux Kernel, OpenShift is a Kubernetes distribution with all the needed tools and tricks to make full use of it.
OpenShift comes in two flavors:

  • OpenShift Container Platform: Software product to install in your data center and get support by Red Hat.
  • OpenShift Origin: The open source upstream project with a very active GitHub repository.

OpenShift enables you to develop faster – after committing your changes in GIT it solves container image build, storage, deploy, scaling, monitoring, and logging for you so you don’t have to do it. The integrated build and deployment processes help you get the developed application to the customer as fast as possible. It enables you to deploy hourly or even faster, and scale computing resources per project automatically with your user base.

How to get started?

There are many many ways to get started, here are a few hints and examples:

  • Install your own OpenShift cluster for example on Exoscale with the official Ansible Playbooks. By using these playbooks you learn to customize every inch of the installation and configuration, and they also help you upgrade from one version to another. Documentation about these playbooks can be found inside the Git repository or on the documentation page.
  • Start a local OpenShift cluster on your workstation with Minishift (based on Minikube) or with the fancy command oc cluster up. Just download the client binary from the GitHub releases page, unpack it, and then run the oc cluster up command. This will launch a complete OpenShift instance on your local Docker Engine:

.

% oc cluster up
Starting OpenShift using openshift/origin:v3.6.0 ...
Pulling image openshift/origin:v3.6.0
Pulled 1/4 layers, 28% complete
Pulled 2/4 layers, 83% complete
Pulled 3/4 layers, 88% complete
Pulled 4/4 layers, 100% complete
Extracting
Image pull complete
OpenShift server started.
The server is accessible via web console at:
You are logged in as:
    User:     developer
    Password: <any value>
To login as administrator:
    oc login -u system:admin
% oc new-app https://github.com/appuio/example-php-sti-helloworld.git
[...]
% oc expose svc example-php-sti-helloworld
[...]
% curl -s http://example-php-sti-helloworld-myproject.127.0.0.1.nip.io/ | grep title
    <title>APPUiO PHP Demo</title>
  • Have a look at the APPUiO Techlabs on GitHub which is a free step-by-step introduction to get started. We offer free half-day workshops.
  • The APPUiO Microservices Example documentation gives some insight for developers on how a Microservice application can be built and deployed on OpenShift, describing tools like Gitlab CI and Jenkins for the build pipelines.

There is a lot of documentation available from upstream. It’s a great source to read about every little detail. You’ll find documentation for both the OpenShift Container Platform and OpenShift Origin. APPUiO also provides a community-driven documentation.

About APPUiO

APPUiO – the Swiss Container Platform – is a managed OpenShift service by Puzzle and VSHN. Your OpenShift platform is managed on any cloud you wish – especially on Exoscale.
With more than two years of experience with OpenShift v3 we’re the leading provider in Switzerland with a deep knowledge in running and operating OpenShift. We’re not only managing dozens of private OpenShift clusters but also a public shared platform.
Running the OpenShift platform continuously and reliably is not easy – it has a lot of moving parts making the lives of developers easier. That’s why we’ve engineered more than 120 cluster checks and 50 checks per server for each APPUiO cluster to ensure proper functionality. This also includes regular end-to-end tests which are simulating the user interaction with the cluster – from building to deploying and accessing an application. We also share a lot of scripts, tools, and documentation on GitHub under the APPUiO organization. Talk to us in the APPUiO Community Chat.
Check out the Exoscale integrations to find out which tools Exoscale is supporting – and come talk to APPUiO about trying out OpenShift for free today!
(Original-Blog veröffentlicht bei www.exoscale.ch )

Tobias Brunner

Tobias Brunner is working since over 20 years in IT and more than 15 years with Internet technology. New technology has to be tried and written about.

Contact us

Our team of experts is available for you. In case of emergency also 24/7.

Contact us
Tech

Distributed Monitoring mit Icinga2 und Puppet

13. Jul 2017

Wir bei VSHN betreiben Applikationen auf Servern und Container Plattformen für Kunden mit verschiedensten Anforderungen. Dabei bilden neben dem Konfigurationsmanagement und der wöchentlichen Maintenance auch die täglichen Backups und natürlich das Monitoring die zentralen Punkte des proaktiven DevOps Betriebs. Bei aktuell über 600 managed Servern mit mehr als 30’000 Services wäre die manuelle Konfiguration sowie das Tuning des Monitorings und der Umsysteme wie InfluxDB, Grafana, etc. recht mühsam – darum haben wir dies komplett automatisiert.

In diesem Blog-Post zeigen wir, wie wir dies bewerkstelligen und wohin die Monitoring-Reise bei VSHN geht.

Architektur

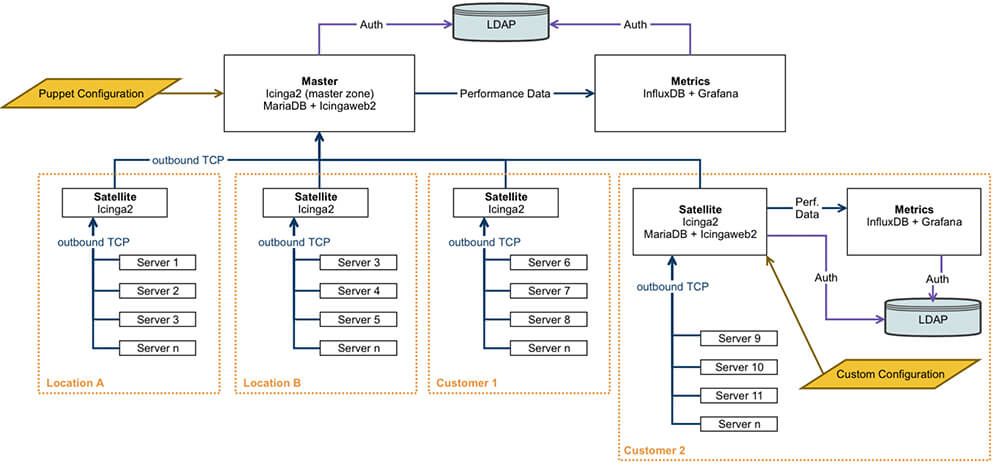
Icinga2 ermöglicht ein komplett verteiltes Monitoring Setup, in dem auf jedem zu überwachenden System eine Icinga2 Instanz läuft. Jeder Client verbindet dann, meistens mit einer ausgehenden TCP Verbindung, verschlüsselt und über x509 authentifiziert, zur Master- oder der überliegenden Satelliten-Zone. Dies ist wichtig, da wir oft Systeme im Enterprise Umfeld betreiben, bei denen wir dann meistens auf einem Jumphost oder dediziert einen Satelliten betreiben. Anschliessend benötigt ausschliesslich dieser eine Verbindung ins Internet zu unserem Monitoring Master.
Des Weiteren kann so ein Server tagelang offline sein und trotzdem haben wir rückwirkend die komplette History und die Performance Daten (man kann auch rückwirkend Performance Daten in die InfluxDB schreiben), weil jede Icinga Instanz lokal ein Replay Log speichert und dieses anschliessend wieder an die überliegende Zone senden kann.
Eine Zone kann auch aus mehreren Icinga2 Instanzen (Servern) bestehen, um die Last zu verteilen und die Verfügbarkeit zu erhöhen.
Für die Authentifizierung und Autorisierung der VSHN- und Kunden-Benutzer ist Icingaweb2 ausserdem an unser zentrales LDAP angebunden. Eine Integration mit Grafana ermöglicht die Vorschau von Performance Data Grafiken direkt in Icingaweb2. Grafana greift auf InfluxDB zu, die wiederum von der Icinga2 Master Instanz mit Performance Daten befüllt wird.

Automatische Konfiguration

Alle unsere Server werden vollständig automatisiert mit Puppet konfiguriert. Dabei weisen wir via Hiera den Servern Rollen zu. Eine Rolle besteht wiederum aus Puppet Profilen (VSHN eigene Puppet Module, die meist auf einem Puppet Base Modul aufbauen). Das Profil steuert immer auch Backup, Firewall und Monitoring. So ist sichergestellt, dass jeder Server eine korrekte Backup-Konfiguration und die richtigen Firewall Rules hat und eben auch automatisch im Monitoring eingerichtet wird. Das heisst, es ist ausgeschlossen, dass ein managed Server nicht im Monitoring eingerichtet ist.

Cluster Konfiguration

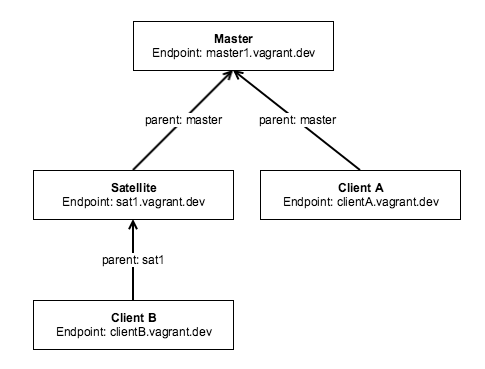
Ein Icinga2 Cluster wird immer mittels Zonen und Endpoints konfiguriert. Zonen können mehrere Endpoints (Server mit Icinga2 Instanz) enthalten.

Die manuelle Konfiguration dazu würde vereinfacht so aussehen:

# zones
object Zone "master" {
  endpoints = [ "master1.vagrant.dev" ]
}
object Zone "sat1.vagrant.dev" {
  parent = "master"
  endpoints = [ "sat1.vagrant.dev" ]
}
...
object Zone "clientB.vagrant.dev" {
  parent = "sat1.vagrant.dev"
  endpoints = [ "clientB.vagrant.dev" ]
}
# endpoints
object Endpoint "master1.vagrant.dev" {
  host = "192.168.33.101"
}
object Endpoint "sat1.vagrant.dev" {
  host = "192.168.12.102"
}
...
object Endpoint "clientB.vagrant.dev" {
  host = "192.168.12.104"
}

Das muss dann noch auf allen beteiligten Server so gemacht werden. Ausserdem müssen neben der Icinga2 Grund- und Feature-Konfiguration entweder die Icinga2 eigene x509 PKI konfiguriert und verwendet oder die Zertifikate auf andere Weise ausgestellt und verteilt werden. Details zur manuellen Konfiguration sind hier zu finden: https://www.icinga.com/docs/icinga2/latest/doc/06-distributed-monitoring/
Bei uns wird das natürlich alles via Puppet gemacht. In der Regel reicht folgende Konfiguration aus Hiera (Beispiel für einen Client, der zu einem Satelliten verbindet):
Beispiel Client hinter Satellite

profile_icinga2::parent_zone: 'sat1.vagrant.dev'
profile_icinga2::parent_endpoints:
  'sat1.vagrant.dev':
    host: '192.168.12.102'
 profile_icinga2 kümmert sich dann um alles, inklusive der Zonen / Endpoint Konfiguration und konfiguriert die sowieso vorhanden Zertifikate der PuppetCA für die Icinga2 API. Das offizielle Puppet Modul für Icinga2 gibt es hier: https://github.com/Icinga/puppet-icinga2

Host und Service Checks – Konfigurations-Flow

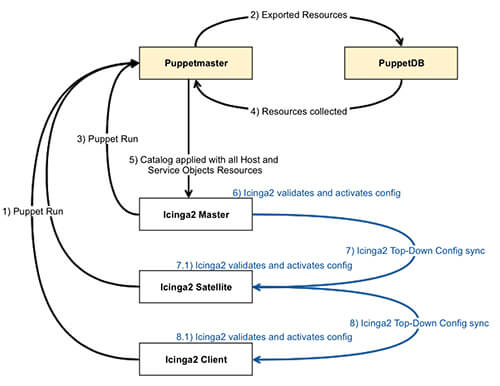
1. Puppet Run auf einem Server inkludiert profile_icinga2 und Service Profile (z.B. profile_mariadb), Beispiel Hieradata:

---
classes:
 - profile_icinga2
 - profile_mariadb
profile_mariadb::manage_monitoring: true # default

2. Icinga2 Profil exportiert

  • Host Object
  • MariaDB Service Check

3. Puppet run auf Monitoring Master
4. Im selben Puppet run auf dem Monitoring Master werden alle Host Objects und Service Objects gesammelt und in Icinga2 angelegt
5. Die Hosts und Services werden im Config Sync Verzeichnis (zones.d) der jeweiligen Client Zone von Puppet angelegt
6. Icinga2 config check wird von Puppet durchgeführt und Icinga2 reloaded
7. Icinga2 synchronisiert die Config via Top-Down-ConfigSync auf alle Satelliten und Clients

  • Jede Satellite und Client Instanz bekommt dabei nur die Config, die ihn auch wirklich betrifft
  • Jede Instanz validiert und aktiviert die Config

8. Icinga2 Satelliten syncen die Configs auf ihre Clients
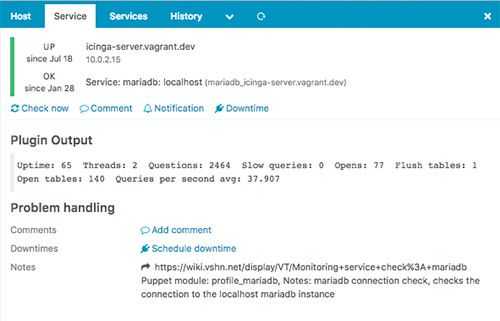
9. Check ist im Monitoring:

Die Nachteile von Exported Resources

Puppet ist unser primäres Konfigurationsmanagement und Automatisierungs-Werkzeug. Allerdings ist bei der Verwendung von Exported Resources immer Vorsicht geboten.

  • Verlust der PuppetDB Daten führt zum Wegräumen aller Hosts und Services im Monitoring, was sich zwar wieder – nachdem jeder Server wieder einen Puppet run gemacht hat – von selbst “heilt”. Trotzdem unschön.
  • Die ganze Sache ist sehr träge, da jede Änderung einen Puppet run auf dem Server (Icinga2 Client) und auf dem Icinga2 Master benötigt, bevor die Änderungen wirksam sind.
  • Der Puppet run auf dem Monitoring Master sammelt tausende Zone-, Endpoint-, Host- und zehntausende Service-Objects Resources zusammen und ergibt somit einen Puppet run, der locker länger als 20-30 Minuten dauert. Das System wird somit noch träger.

Mögliche Lösungen

Wir wollen in Zukunft auf das Einsammeln von Exported Resources verzichten und Icinga2 direkt mit den Daten aus der PuppetDB konfigurieren. Warum? Weil ein Puppet Run auf fast allen Servern im 1-2 Minuten-Bereich oder weniger liegt, der Puppet Run auf dem Monitoring Master jedoch das Problem ist.
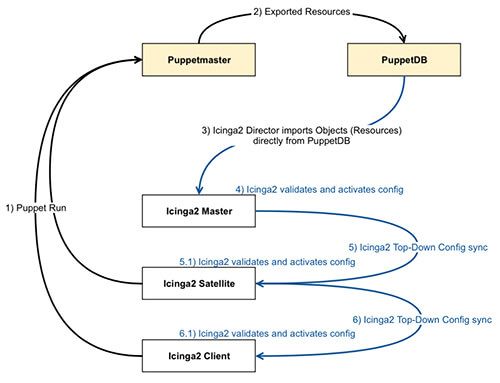
Es gibt auch bereits eine Lösung: Icinga2 Director mit PuppetDB Anbindung 

Dabei würden die Server weiterhin Host und Service Objects via Puppet exportieren, jedoch sammelt ein Import / Sync Job (3) des Directors die Objekte direkt aus der PuppetDB zusammen, filtert und konfiguriert daraus Icinga2 Objekte.

Resultat

Nur noch ein schneller Puppet Run auf den eigentlich betroffenen Server, Änderungen sind innert 1-2 Minuten in Icinga2 aktiv. Der Puppet Run auf dem Monitoring Master gerät in der Hintergrund und ist maximal noch für die Zonen Konfiguration und PKI zuständig, welche im Vergleich zu Service Checks und dem damit verbundenen Tuning eher statisch ist.

Fazit

Verglichen mit der manuellen Konfiguration von Hosts und Services in einem Monitoring System oder der für uns fast komplett unbrauchbaren Auto-Discovery Funktionen anderer Systeme, haben wir mit top Open Source Software eine Lösung geschaffen, die unsere Anforderungen erfüllt, sich komplett in unsere DevOps Arbeitsweise integriert und uns somit den proaktiven Betrieb für unsere Kunden ermöglicht sowie extrem vereinfacht. Es gibt aber an zahlreichen Punkten Verbesserungspotential und uns wird es darum sicher nie langweilig.
Mehr zu Distributed Monitoring mit Icinga2: https://www.icinga.com/docs/icinga2/latest/doc/06-distributed-monitoring/
Dies wird sicher nicht der letzte Blog Post zu Icinga2, Icinga2 Director, Monitoring usw. gewesen sein.

Marco Fretz

Marco is one of VSHN's General Managers and Chief Operating Officer.

Contact us

Our team of experts is available for you. In case of emergency also 24/7.

Contact us
Tech

Tame the Cat

27. Jun 2017

Einen eigenen Tomcat Server zu betreiben, kann unter gewissen Umständen ein aufwendiges und mühsames Unterfangen sein.
Daher haben wir mithilfe von Puppet ein eigenes Tomcat-Hosting-Profil entwickelt. Dabei greifen wir auf das bestehende Puppet Modul von Puppetlabs zurück. Ziel dieses Puppetmodules ist es, in kurzer Zeit einen Tomcatserver bereitzustellen, der alle nötigen Konfigurationen beinhaltet sowie in einer einheitlichen und standardisierten Art und Weise aufgesetzt ist. So soll ein Update der Tomcat Version einfach und schnell möglich sein.

In diesem Blog-Post erläutern wir kurz, was unser Puppet-Modul alles kann und zeigen auf, wie einfach es ist, eine neue Tomcat Instanz aufzusetzen.

Architektur

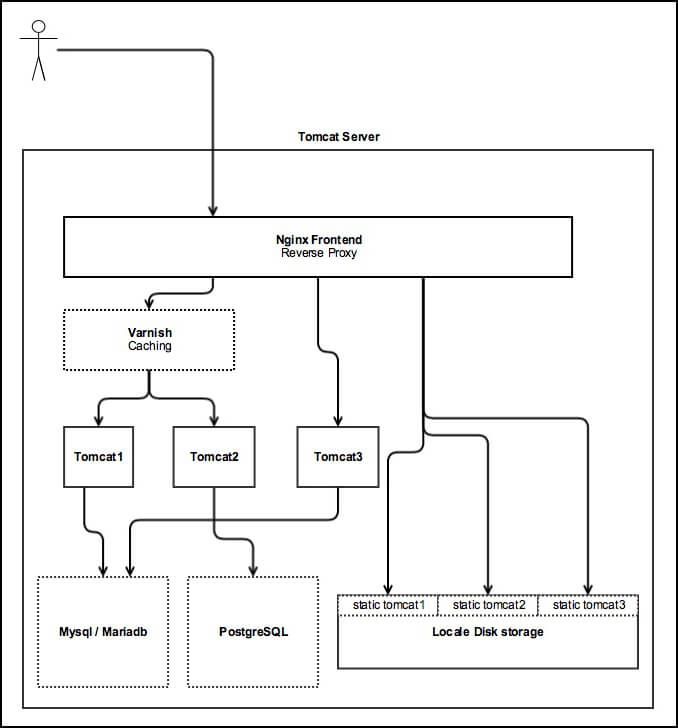
Bevor wir zur Beschreibung des eigentlichen Moduls kommen, zeigen wir kurz auf, welche Komponenten installiert und konfiguriert werden.

Im oben stehenden Diagramm sehen wir die Grundarchitektur eines klassischen Tomcathostings.
Wir verwenden für unser Setup:

  • ein Nginx als Reverse-Proxy für die SSL-Terminierung
  • optional Varnish für das Caching
  • Mysql/Mariadb und/oder PostgreSQL als Datenbank-Server

Der komplette Server lässt sich dabei in einem yaml-file konfigurieren:

---
classes:
  - profile_tomcathosting
profile_tomcathosting::servers:
  'tomcat8.5.15':
    source_url: 'http://www-eu.apache.org/dist/tomcat/tomcat-8/v8.5.15/bin/apache-tomcat-8.5.15.tar.gz'
  'tomcat7':
    source_url: 'http://www-eu.apache.org/dist/tomcat/tomcat-7/v7.0.78/bin/apache-tomcat-7.0.78.tar.gz'
profile_tomcathosting::db_root_pw: 'mySuperS3cretR00tPw'
profile_tomcathosting::varnish_version: '4.1'
profile_tomcathosting::varnish_template: 'profile_tomcathosting/varnish/defaultv4.vcl.erb'
profile_tomcathosting::tomcat_base: '/home'
tomcathosting_sites:
  'mytomcathosting':
    server_name: 'mytomcathosting.com'
    db_password: 'anothergre@tp@$w0rd'
    use_static: true
    use_varnish: true
    use_mariadb: true
    manage_tls: 'letsencrypt'
    offset: 1
    suppress_version: false
    tomcat_server: 'tomcat8.5.15'
  'legacy_tomcathosting':
    server_name: 'legacy-tomcathosting.com'
    db_password: 'myother_dbP@$swort'
    use_static: false
    use_varnish: false
    use_mariadb: false
    use_postgresql: true
    manage_tls: 'letsencrypt'
    offset: 2
    suppress_version: true
    tomcat_server: 'tomcat7'

Dies reicht schon, um einen Server mit Tomcat7 sowie Tomcat8 zu installieren, sowie zwei Instanzen, die jeweils einen der beiden installierten Tomcats verwendet.
Die Konfiguration im oben stehenden Listing installiert unter /opt/tomcat8.5.15 sowie unter /opt/tomcat7 jeweils einen Tomcat. So werden zwei neue User angelegt (mytomcathosting und legacy_tomcathosting) mit dem Homeverzeichnis unter /home (default ist /var/lib/tomcat, wenn tomcat_base nicht angegeben wird). Dort wird von Puppet im Unterordner tomcat/ die Verzeichnisstruktur für eine Tomcatinstanz eingerichtet. Des Weiteren erstellt Puppet auch die Konfigurationsdateien von Tomcat im Ordner: tomcat/config/. Für mytomcathosting wird zusätzlich ein Ordner static im Homeverzeichnis angelegt.
Wenn wir uns die generierte nginx config genauer ansehen, sehen wir, dass für mytomcathosting eine zusätzliche Location für static content konfiguriert wurde. Zudem leitet die proxy_pass Direktive nicht zur Tomcatinstanz, sondern zum installierten Varnish. Damit Varnish die verschiedenen vhosts unterscheiden kann, setzten wir zusätzlich den varnish_host Header:
mytomcathosting.com Nginx config server

{
  listen       *:443 ssl ;
  server_name  mytomcathosting.com;
  ssl on;
  ssl_certificate           /etc/ssl/certs/mytomcathosting.com-chained.pem;
  ssl_certificate_key       /etc/ssl/private/mytomcathosting.com-key.pem;
  ssl_dhparam               /etc/ssl/dh4096.pem;
  [...]
  add_header              Strict-Transport-Security max-age=31536000;
  location /static/ {
    root      /home/mytomcathosting/;
    index     index.html index.htm index.php;
  }
  location / {
    proxy_pass            ;
    proxy_read_timeout    90;
    proxy_connect_timeout 90;
    proxy_redirect        off;
    proxy_set_header      varnish_host mytomcathosting;
    proxy_set_header      Host mytomcathosting.com;
    proxy_set_header      X-Scheme $host;
    proxy_set_header      X-Forwarded-Host $host;
    proxy_set_header      X-Forwarded-Server $host;
    proxy_set_header      X-Forwarded-Server-IP $server_addr;
    proxy_set_header      X-Forwarded-Server-Port $server_port;
    proxy_set_header      X-Forwarded-For $proxy_add_x_forwarded_for;
    proxy_set_header      X-Real-IP $remote_addr;
    proxy_set_header      X-Forwarded-Client-IP $remote_addr;
    proxy_set_header      Proxy "";
  }
}

legacy-tomcathosting.com Nginx config server

{
  listen       *:443 ssl ;
  server_name  legacy-tomcathosting.com;
  ssl on;
  ssl_certificate           /etc/ssl/certs/legacy-tomcathosting.com-chained.pem;
  ssl_certificate_key       /etc/ssl/private/legacy-tomcathosting.com-key.pem;
  ssl_dhparam               /etc/ssl/dh4096.pem;
  [...]
  add_header              Strict-Transport-Security max-age=31536000;
  location / {
    proxy_pass            ;
    proxy_read_timeout    90;
    proxy_connect_timeout 90;
    proxy_redirect        off;
    proxy_set_header      Host legacy-tomcathosting.com;
    proxy_set_header      X-Scheme $host;
    proxy_set_header      X-Forwarded-Host $host;
    proxy_set_header      X-Forwarded-Server $host;
    proxy_set_header      X-Forwarded-Server-IP $server_addr;
    proxy_set_header      X-Forwarded-Server-Port $server_port;
    proxy_set_header      X-Forwarded-For $proxy_add_x_forwarded_for;
    proxy_set_header      X-Real-IP $remote_addr;
    proxy_set_header      X-Forwarded-Client-IP $remote_addr;
    proxy_set_header      Proxy "";
  }
}

Die angegebenen Zertifikate wurden via Let’s Encrypt erstellt und werden automatisch erneuert.
Zusätzlich wird für mytomcathosting eine mariadb Datenbank und für legacy-tomcathosting eine PostgresSQL Datenbank konfiguriert. Damit sichergestellt ist, dass die Tomcat Instanzen auch laufen, erstellt unser Puppet Modul Systemd Unit-Files. Dabei wird als CATALINA_HOME der Pfad zum ausgewählten Tomcatserver verwendet und als CATALINA_BASE der Pfad zum Tomcatverzeichnis der Instanz.
Das Unitfile für mytomcathosting sieht daher wie folgt aus:
mytomcathosting Unitfile

[Unit]
Description=tomcat-mytomcathosting Service
[Service]
ExecStart=/opt/tomcat8.5.15/bin/catalina.sh start
ExecStop=/opt/tomcat8.5.15/bin/catalina.sh stop
Restart=always
StandardOutput=syslog
StandardError=syslog
SyslogIdentifier=tomcat-mytomcathosting
User=%i
Type=forking
Environment="CATALINA_HOME=/opt/tomcat8.5.15" "CATALINA_BASE=/home/mytomcathosting/tomcat"
[Install]
WantedBy=multi-user.target

Backup und Monitoring

Backup und Monitoring gehören bei uns zur Selbstverständlichkeit. So wird jede konfigurierte Instanz automatisch ins Backup aufgenommen (User Homeverzeichnis, sowie DB Dumps). Monitoringchecks, die überprüfen, ob die Tomcat Instanzen laufen, werden automatisch eingerichtet. Ebenfalls vollautomatisch wird geprüft, ob der konfigurierte Servername erreichbar ist und einen validen HTTP Code zurückgibt.

Tomcat aktualisieren

Eine bestehende Instanz auf eine neuere Tomcatversion zu aktualisieren ist sehr einfach und in wenigen Minuten erledigt. Dabei muss nur im profile_tomcathosting::servers Hash ein neuer Server mit der gewünschten Version installiert werden und dann in der zu aktualisierenden Instanz im tomcat_serverFeld referenziert werden. Sollte ein Tomcat Server nicht mehr verwendet werden, kann dieser durch das Setzen des ensure: ‘absent’ Parameters im profile_tomcathosting::servers Hash einfach entfernt werden.

Fazit

Der Betrieb einer Tomcatumgebung ist dank unserem Puppet Modul sehr einfach, schnell und zuverlässig. Dank dem modularen Aufbau der Puppet Module, können wir mit sehr geringem Aufwand verschiedene Tomcat Szenarien abdecken. In nur 15 Minuten können wir eine neue VM (z.b. bei Cloudscale.ch) hochfahren und mit Puppet so konfigurieren, dass wir eine einsatzbereite Tomcatumgebung haben. 

Nicolas Bigler

Contact us

Our team of experts is available for you. In case of emergency also 24/7.

Contact us
Tech

Alles über Update-Prozesse und Paketaktualisierungen auf verteilten Systemen

2. Jun 2017

Die zunehmende Virtualisierung von Maschinen hat viele Vorteile, bringt aber auch eine Reihe von Herausforderungen mit sich. Eine davon ist die kontinuierliche Aktualisierung der Pakete auf einer stetig wachsenden Anzahl von Systemen. Das eine Mal soll ein aktueller Sicherheitspatch möglichst zeitnah eingespielt werden, ein anderes Mal muss die Applikation des Kunden im vordefinierten Zeitfenster auf den neuesten Stand gebracht werden: Die Anforderungen sind unterschiedlich und nicht immer einfach unter einen Hut zu bringen. Und je mehr der Serverpark wächst, desto schwieriger wird es, die Übersicht zu wahren.

Bei VSHN machen wir Systemupdates üblicherweise einmal pro Woche, jeweils dienstags. Dies ermöglicht es uns, bei eventuellen Problemen in aller Ruhe reagieren zu können, bevor alle ins Wochenende abgerauscht sind und lässt gleichzeitig zu Beginn der Woche genügend Zeit um aktuelle Probleme wahrnehmen und entsprechend planen zu können. Im Laufe der Zeit sind wir auf so manche Herausforderungen gestossen, die die Problematik mit sich bringt. Nicht für alle haben wir bereits befriedigende Lösungen gefunden – bei einigen scheint es uns gar keine “wirkliche” Lösung zu geben – doch möchten wir hier die Möglichkeit wahrnehmen, unsere Überlegungen und Lösungen zu einigen der Schwierigkeiten darzulegen, die wohl verbreiteter auftreten dürften.

Kundeninformation

Viele Aktualisierungen betreffen Details: es werden spezifische Fehler gefixt, von denen der Kunde üblicherweise gar nichts mitbekommt. Innerhalb einer OS-Revision sollten Updates normalerweise die Funktionsweise nicht verändern (vorausgesetzt, Programmfehler wurden nicht explizit ausgenutzt). Dennoch gibt es immer wieder Aktualisierungen, die Kernfunktionalitäten des Kundensystems betreffen – ein Update der eingesetzten Datenbanksoftware zum Beispiel, oder des Webservers – oder einen Neustart von Teilen des Systems, manchmal auch der ganzen Maschine erfordern. In jedem Fall ist damit zu rechnen, dass ein Serviceunterbruch stattfindet, und sei es auch nur für wenige Sekunden. Entsprechend ist es wichtig, dass der Kunde rechtzeitig und umfassend informiert ist. Dies gestaltet sich aber nicht immer einfach, da die Kundenbedürfnisse teils sehr unterschiedlich sind:

  • Die meisten unserer Kunden verstehen Deutsch und wünschen auch, in ihrer Muttersprache zu kommunizieren. Mit anderen hingegen wird Englisch gesprochen, wenn nicht gar Portugiesisch, Holländisch oder Finnisch.
  • Ein individuelles Ansprechen der Kunden mit Namen ist wünschenswert, aber bei manueller Ausführung sehr zeit-intensiv und tendenziell fehleranfällig.
  • Die verschiedenen Systeme haben verschiedene Anforderungen: einen Kunden mit mariadb interessiert es nicht, ob ein Upgrade von postgresql ansteht und jenem, der nginx einsetzt, sind die Sicherheitsprobleme von Apache egal.
  • Je nach SLA (“Service Level Agreement”) findet die Ausführung zu verschiedenen Zeiten statt. Manche Kunden wünschen die Aktualisierung aus Kostengründen stets zu Bürozeiten, andere nur diejenigen von unkritischen Paketen ohne erwartete Auswirkung auf die Kundenapplikation und bei dritten wiederum finden alle Updates grundsätzlich im “Maintenance Window” in der Nacht statt. Idealerweise wird dem Kunden die geltende Abmachung regelmässig kommuniziert – und zwar rechtzeitig vor dem Update, so dass er falls nötig für diese Woche ein anderes Vorgehen beantragen kann – zum Beispiel, weil an diesem Tag eine Präsentation stattfindet.

Ursprünglich informierten wir jeden Kunden einzeln per E-Mail, doch konnte sich dieses Modell nicht allzu lange halten. Nur schon aus Zeitgründen kamen wir nicht umhin, stattdessen auf eine generelle Webseite zu verweisen, auf der über die jeweils anstehenden Subsysteme informiert wird. Dafür setzen wir heute Cachet ein und benutzen es auch als generelle Status-Informationsseite bei auftretenden Störungen. Der Kunde kann sich die Informationen selbstständig abonnieren und erhält damit nicht nur die wöchentliche e-Mail über anstehende Updates automatisch, sondern wird auch zeitnah informiert, wenn einmal generelle Probleme mit der Infrastruktur auftreten. Der Server läuft selbstverständlich in einem anderen Rechenzentrum und in einem unabhängig gerouteten Netz, damit bei eventuell auftretenden Problemen auch tatsächlich informiert werden kann.
Gibt es schliesslich während des Update-Prozesses Schwierigkeiten, so sollen die Kunden auch darüber zeitnah informiert werden – so detailliert wie nötig (aber auch nicht übertrieben pointiert) und mit einer Angabe, wie wir planen, die Herausforderung in Zukunft anzugehen.

Checkliste

Mitarbeiter, die selbst nicht an der Aktualisierung teil nahmen, sollten zumindest grob darüber Auskunft geben können, was geschah und weshalb. Gerade wenn einmal etwas Gröberes schief läuft und die ausführenden Mitarbeiter vielleicht bis frühmorgens mit Reparaturarbeiten beschäftigt waren, ist es wichtig, dass ausgeschlafene Kollegen informieren können. Eine entsprechende Dokumentation ist deshalb unumgänglich, wenn auch – gerade, wenn’s mal wieder etwas länger dauerte – nicht immer ganz einfach fertigzustellen. Wir setzen auf eine technisch simple, aber in der Praxis recht effektive Checkliste in unserem internen Wiki; das zugehörige Template wird fast jede Woche angepasst, erweitert und mit Links zu Hinweisen, wie bei eventuellen Problemen vorgegangen werden kann versehen. Nach jeder Gruppe von Servern die gleichzeitig abgearbeitet wurden, wird alles Unvorhergesehene protokolliert und das entsprechende Häkchen gesetzt. Dies ermöglicht es uns auch, im Nachhinein nachzuvollziehen, wo der Prozess noch verbessert werden kann.

Aktualisierungstools

Die Effizienz der Updates steht und fällt mit dem verwendeten Werkzeug. Leider ist uns bis anhin kein abschliessend befriedigendes Tool untergekommen; die Umsetzung einiger wünschenswerter Features ist aber auch nicht ganz trivial. Da wir momentan nur Debian- oder RedHat-basierte Linuxdistributionen einsetzen, reicht es glücklicherweise bisher zumindest aus, dass das eingesetzte Tool nebst apt und deb auch noch yum/dnf und rpm versteht.
Zur Zeit setzen wir apt-dater der IBH IT-Service GmbH ein, das wir im Laufe der Zeit in der Konfiguration an unsere Bedürfnisse angepasst haben. Es gibt durchaus noch Verbesserungspotential, aber der Aufwand, selbst etwas zu entwickeln dürfte doch ziemlich hoch sein. Folgende Anforderungen wären grundsätzlich wünschenswert:

  • Schnelle Übersicht über anstehende Aktualisierungen. Eine Idee wäre, anstatt zu jedem Server die veralteten Pakete aufzulisten, den umgekehrten Ansatz zu implementieren: Eine Liste aller Pakete, die auf mindestens einem Host ein Update benötigen. Super wäre dann ein Interface, in dem man unkritische Pakete ausblenden könnte (Stichwort “Tinder-Style”), um sich schnell auf die wesentlichen, kritischen Pakete zu konzentrieren.
  • Updaten soll einfach sein – aber doch nicht zu einfach. Es ist in der Vergangenheit schon vorgekommen, dass Server versehentlich aktualisiert wurden, weil ein einzelner Tastendruck eine ganze Reihe von Aktionen ausführen kann – praktisch nicht unterbrechbar. Dass “Update” im apt-Jargon dann auch noch fürs Updaten der Metainformationen (und nicht der eigentlichen Pakete) steht macht die Ausgangslage auch nicht einfacher. In der Praxis ist dies aber nur ein Problem, wenn stets neue Mitarbeiter die Upgrades übernehmen.
  • Nebst der Update-Funktionalität sollten auch auto-removes automatisiert ausgeführt werden können.
  • apt-dater parst die Ausgaben der apt-Prozesse auf den Zielsystemen und warnt zum Beispiel bei Vorkommen des Worts “error”. Prinzipiell eine gute Idee – aber wenn der Update-Prozess den Satz “no error occured” enthält kann das Abnicken jeder einzelnen Meldung ziemlich mühsam werden. Dieses Problem haben wir mittlerweile mittels detaillierterer Konfiguration lösen können.
  • Anders als yum verlangt apt standardmässig gerne mal eine manuelle Intervention. Das hat durchaus seine Vorteile; auch hier gilt aber: muss das auf jedem Server einzeln bestätigt werden (teilweise auch mehrfach, wenn beispielsweise noch mehrere ältere Kernel installiert sind), so kann einiges an Zeit verloren gehen.

Paket – Cache

Ein Problem, das uns lange beschäftigte, war der Umgang mit Repositories, die zeitweise nicht erreichbar oder in inkonsistem Zustand sind. Gerade bei Ubuntu-Mirrors kommt es immer mal wieder vor, dass die Indizes nicht korrekt erstellt werden und eine Viertelstunde gewartet werden muss, bis der nächste cronjob diese flickt. Das bedeutete dann Zwangspausen – manchmal mehrmals täglich. Auch gibt es immer mal wieder Pakete, die während des Tages neu hinzukommen. Werden diese dann eingespielt, so geht das “Kanarienvogelprinzip” – wir wollen zuerst auf Staging- und weniger wichtigen Systemen updaten, um eventuelle Probleme frühzeitig zu erkennen – verloren. Und last but not least sind viele Mirrors so konfiguriert, dass sie nur eine begrenzte Zahl von Anfragen von einer IP oder einem IP-Range zulassen, um DOS-Attacken zu verhindern. Kommen nun eine grosse Anzahl von Anfragen praktisch gleichzeitig, zum Beispiel von einem Kunden, bei dem alle Systeme hinter einer gemeinsamen Firewall stehen, so kann nur ein kleiner Teil davon beantwortet werden und der Vorgang muss mehrere Male wiederholt werden, bis alle Systeme einmal bedient wurden.
Einen grossen Fortschritt erreichten wir für all diese Probleme mit der Einführung eines Paket-Caches. Grob gesagt führten wir einen Proxy ein, über den alle Repositories geleitet werden. Am Morgen des Update-Tages holen nun alle Systeme die anstehenden Pakete ab, ohne sie zu installieren – sie versuchen dies drei Mal, um die obengenannten Probleme mit Indizes zu umgehen. Der Paket-Cache lädt die Pakete herunter, liefert sie aus und speichert die Versionen. Der erste Schritt der eigentlichen Update-Prozedur besteht sodann im “Einfrieren” dieses Caches: ab diesem Zeitpunkt werden nur noch genau die Versionen von Indizes und Paketen ausgeliefert, die dann aktuell waren (Ausnahme: Wird im Laufe des Tages ein Paket angefordert, das noch nicht im Cache vorhanden ist, zum Beispiel bei einer Neuinstallation, so lädt der Cache die zu diesem Zeitpunkt aktuelle Version nach).
Während das Einpflegen der entsprechenden Konfigurationen einen gewissen – pro Repository einmaligen – Zusatzaufwand bedeutet, konnten wir mit dieser Methode die Updateprozedur deutlich beschleunigen – ganz zu schweigen von der massiven Diminuierung des Frustfaktors.

Systemgruppierung

Wie bereits bei der Kundeninformation ausgeführt, haben unterschiedliche Systeme unterschiedliche Anforderungen. Eine Testumgebung, wenn auch aus der selben Anzahl und Typisierung an Servern wie ein Livesystem bestehend, kann typischerweise gut zu Bürozeiten aktualisiert werden – ja, soll dies sogar explizit, um eventuelle Probleme rechtzeitig festzustellen und entsprechend darauf reagieren zu können – während die Produktivumgebung nur eine minimale Downtime in der Nacht erlaubt. Gleichzeitig ist es aber für einen effizienten Vorgang auch wünschenswert, möglichst wenige Gruppen zu bilden, die jeweils gemeinsam aktualisiert werden können. Und selbstredend müssen neu erstellte Systeme automatisiert in den Prozess aufgenommen werden, damit sie nicht vergessen gehen.
Wir haben mit einer Reihe von Namensschemen für die Gruppen experimentiert und sind inzwischen dabei angekommen, die gleichzeitig abzuarbeitenden System in Gruppen zusammen zu fassen, die dem Namensschema “hhmm-prio-common_name” folgen, also z.B. “2200-20-night_main” für die erste grosse Gruppe der Server, die ab 22:00 Uhr anfallen. Jede Gruppe ist in der Checkliste aufgeführt und erst wenn alle zugehörigen Server fertig gestellt und das Monitoring wieder komplett zufrieden ist schreiten wir zur nächsten Gruppe fort.
Um das Problem der Erreichbarkeit zu vereinfachen setzten wir ursprünglich auf die einfache Lösung, das Update-Tool auf einem Monitoring-Host zu installieren, da von da aus sowieso schon VPNs zu allen relevanten Maschinen bestanden. Inzwischen haben wir aber sowohl das Monitoring via VPN als auch die ssh-Zugänge durch bessere Methoden ersetzt. Konkret kennt unser puppet die benötigten Jumphosts, um jeden gemanageten Server zu erreichen und mittels dem selbst entwickelten “sshop”-Tool wird nicht nur die entsprechende ssh-Konfiguration, sondern auch gleich jene für apt-dater geschrieben.

Reboots

Wird ein Sicherheitsleck im Kernel bekannt, so ist ein Reboot unumgänglich; aber auch ein Update einer kritischen Komponente wie openssl kann oft einfacher fertiggestellt werden, indem die ganze Maschine neu gestartet wird (anstatt jeder betroffene Service, der die Bibliothek geladen hat, einzeln). Bei Reboots gibt es aber immer eine Reihe von potentiellen Fehlerquellen, die verstärkter Aufmerksamkeit bedürfen:

  • Die Sicherheitsanforderungen einer Reihe von Kunden verlangen, dass alle Daten verschlüsselt abgelegt sein müssen. Um die Harddisks verfügbar zu machen, muss bei einem Reboot entsprechend der Schlüssel eingegeben werden. Klassischerweise geschieht dies via Konsole – diese muss also erreichbar sein und das Passwort bekannt (gleichzeitig aber kompliziert genug, um sicher zu sein und nur via speziell und mehrfach abgesicherten Zugang abrufbar). Um dies zu umgehen setzen wir darauf, das Hauptsystem unverschlüsselt zu lassen und nur die kritischen Daten auf einer eigenen Partition zu verschlüsseln, welche dann beim Bootprozess nicht gemountet wird. Wir loggen uns nach dem Reboot normal via ssh auf dem Server ein und starten einen speziellen Service, der die Passworteingabe, das Mounten und das Starten der davon abhängigen Services – je nach System via sysvinit, upstart oder systemd – übernimmt. Selbstverständlich sind die Hosts, auf welchen dies vonnöten ist, in der Checkliste aufgeführt und werden spezifisch gemonitort, damit sie garantiert nicht vergessen gehen können.
  • Mounts von anderen Servern werden manchmal nicht automatisch geladen, da eine Nichterreichbarkeit des Wirtsystems ansonsten den Bootvorgang unterbrechen oder zumindest massiv verlangsamen würde. Entsprechend sind benötigte Daten teilweise erst nach einem puppet-run erreichbar; dieser soll also zeitnah nach dem Booten erfolgen.
  • Services müssen reboot-sicher konfiguriert werden; das heisst sie müssen nach einem Reboot wieder gestartet werden und sollen den Betrieb möglichst reibungslos wieder aufnehmen. Das ist manchmal einfacher gesagt als getan: wenn eine Datenbank neu indiziert oder grosse Datenmengen geladen werden müssen kann das schon mal eine Weile dauern.
  • Die Reihenfolge von Reboots bei mehreren zusammengehörenden Servern ist oft relevant: So sollen Datenbank und Fileserver idealerweise vor Applikationsservern neu gestartet werden und diese wiederum vor Webservern und Applikationsfirewalls. Auch dürfen in Clustern zusammengehörende Server nur sequentiell rebooted werden. Dies stellen wir mit der erwähnten Gruppierung der Systeme sicher.
  • Ebenfalls mit der Gruppierung lösen wir ein Problem, das zwar trivial erscheint, aber ansonsten in der Hitze des Gefechts dennoch übersehen werden kann: Bei redundanten Systemen ist stets darauf zu achten, dass das Backup erst aktualisiert wird, wenn der gesamte Vorgang auf dem Primärsystem erfolgreich abgeschlossen wurde. So wird nicht nur die Redundanz getestet, sondern es werden eventuelle Probleme auch tatsächlich nach dem Update des ersten Systems entdeckt – und nicht erst, wenn schon beide Maschinen verändert wurden.

Monitoring

Obwohl die heutigen virtuellen Maschinen innert weniger Sekunden wieder betriebsbereit sind, haben Updates und insbesondere Reboots zumindest kurze Ausfälle zur Folge. Ein dadurch verpasster puppet-run kann sich aber schnell mal für eine halbe Stunde im Monitoring niederschlagen. Entsprechend ist immer downtime einzuplanen. Ebenso sollte für mindestens rund eine Stunde nach Abschluss der Arbeiten etwas genauer aufs Monitoring geschaut werden: manchmal offenbaren sich Probleme erst, nachdem puppet auf zwei verschiedenen Maschinen durchgelaufen ist (Stichwort: exportierte Ressourcen). Ausserdem hilft es enorm, wenn Abhängigkeiten im Monitoring korrekt erfasst sind: der zeitweise Unterbruch eines VPN darf nicht dazu führen, dass sämtliche Services auf sämtlichen sich dahinter befindlichen Servern als nicht erreichbar erkannt werden.

Schlussfolgerungen und Ausblick

Der Update-Prozess ist ein sich ständig wandelnder, der kontinuierlich verbessert wird. Währenddem wir im Laufe der Jahre schon viele Details perfektioniert haben gibt es immer noch Verbesserungspotential. Und für die Zukunft planen wir eine gewisse Automatisierung auch dieser Aufgabe; doch wollen wir 100% sicher sein, dass dabei nichts schief gehen kann und so ist hier noch einiges an Entwicklungsarbeit einzubringen. Da es sich aber in der jetztigen Form immer noch um einen recht zeitintensiven und wöchentlichen Prozess handelt lohnt sich dies gewiss. Sind wir dann erst mal soweit, wird dies sicher wieder mit einem ausführlichen Blogpost abgerundet. Bis dann! 

peter.rueegg

Contact us

Our team of experts is available for you. In case of emergency also 24/7.

Contact us
Tech

VSHN Startup Boost – free DevOps consulting for startups

24. May 2017

We’re an almost three year old technology startup ourselves and know the challenges of getting all of the stars lined up correctly to create a successful company. As we have found our business model and are growing quickly we want to recall our roots and give something back to the community.
… diese Informationen in Deutsch >>

That’s what the VSHN Startup Boost is all about:
reaching out and helping other startups to get the boost they need to prove their ideas and succeed.

The VSHN Startup Boost is a technical mentoring program for startups in the software, technology or online areas.
Usually the CTO or Head of software engineering would be the right person to attend. You can apply for the mentoring using the form below –
typically we accept one startup per month although exceptions may occur. We’ll get in touch with you in any case.
Most startups have a clear vision about the product they want to build and the technology they want to use (and have had experience with).

  • Systems architecture for bootstrapping and the first scaling iteration
  • How to implement continuous integration and continuous delivery using free services and/or open source tools
  • How to containerize/dockerize your application, if necessary
  • How to build a local development environment with all the required containerized service dependencies
    (backends, microservices, databases, caches, etc.)
  • Compare and connect you with other (free) services for startups
    (e.g. Microsoft BizSpark, Amazon AWS, Heroku, APPUiO.ch, etc.)
  • Anything else you might struggle with In line with the DevOps philosophy we consider the optimal outcome to be you having a working
    software delivery process (build, test, deploy) up and running by the end of the mentoring session. The goal is to provide you with the
    software operations experience you need to get started, validate your product and start growing by focusing on the software development.

Half a day of free consulting with one of our senior DevOps Engineers

APPUiO.ch-voucher for half a year of free usage

We’re happy to write a blogpost about your company and let you speak at one of our KickOffBreakfasts so you get some visibility in the market.
If you would like to apply for the VSHN Startup Boost or if you have any questions please get in touch with us using the form below.


Aarno Aukia

Aarno is Co-Founder of VSHN AG and provides technical enthusiasm as a Service as CTO.

Contact us

Our team of experts is available for you. In case of emergency also 24/7.

Contact us
Tech

APPUiO Product Roadmap

10. Apr 2017

Eine der grössten Herausforderungen für uns als modernes Technologie-Unternehmen ist es, immer auf dem aktuellsten Stand der Technik zu bleiben. VSHN macht das bereits erfolgreich und auch bei APPUiO ist eine stetige Weiterentwicklung spürbar. Nach dem Launch des Beta-Angebotes (more…)

Tobias Brunner

Tobias Brunner is working since over 20 years in IT and more than 15 years with Internet technology. New technology has to be tried and written about.

Contact us

Our team of experts is available for you. In case of emergency also 24/7.

Contact us
Internal Tech

VSHN ist Azure Silver Partner

Wir betreiben die Applikationen unserer Kunden auf verschiedenen Cloud-Providern, je nach Anforderungen an Sicherheit, Verfügbarkeit, Skalierbarkeit, geographischer Abdeckung und bestehender Infrastuktur des Kunden. Neben Cloudscale.ch, Exoscale.ch, SafeSwissCloud und Swisscom Enterprise in der Schweiz sind wir auch Partner von Amazon AWSund neu auch zertifizierter Silver Partner für Opensource Software Stacks auf Microsoft Azure. 

Die Zertifizierung zeigt dem Kunden, dass VSHN die entsprechenden Erfahrung im Aufbau und Betrieb von Opensource-Applikationsservern (Java, PHP, Python, Ruby, JavaScript, Erlang/Elixir, etc) und Datenbanken (MySQL, MariaDB, PostgreSQL, MongoDB, Cassandra, ElasticSearch, Solr, Redis, etc) hat. Die Partnerschaft steht auch für eine eingespielte, konstruktive Zusammenarbeit im Support – VSHN ist für seine “no finger-pointing policy” bekannt, also anstatt Schuldzuweisungen zu machen, werden konstruktiv mit allen beteiligten Parteien zusammen Probleme gelöst.

Aarno Aukia

Aarno is Co-Founder of VSHN AG and provides technical enthusiasm as a Service as CTO.

Contact us

Our team of experts is available for you. In case of emergency also 24/7.

Contact us